Speaker III – Output Conundrum Solved

Image

Today’s lesson is in INPUT SATURATION.  Yep, during the close mic testing I was saturating the A/D input.  This is what caused the strange differences in lower vs. upper mid-woofer 🙁

Below is a close-mic test without saturation.  The output level on the signal generator are separated by 10 dB.  The cyan line is the difference, showing that the difference is +10 db above 100 Hz.  Below 100 Hz the ambient noise on the lower volume recording interferes with the test.

Test2 m45 vs m55

Now raise the signal level by 10 dB as shown below.  No need to take a difference, the blue curve is clearly not 10 dB greater than the green line.

Test2 m35 vs m45

Speaker III – Output Conundrum

Multiple close mic measurements on the mid-ranges have showed the same phenomenon over and over again: the lower mid-range has greater low-frequency output than the upper mid-range.  About 2 dB more output, which is significant!  I would expect less output from the lower mid-range given that it has a 2 mH inductor with a significant DC resistance.

The first test is comparing each mid-range’s TS parameters.  The results are the upper mid-range efficiency is +1 dB over the lower mid-range!  A close mic of the two mid-ranges with the 2.0 mH inductor removed show they are within 0.5 dB of each other.  Hmmm.  Retest with the 2.0 mH inductor on the lower mid-range and voila!  The inductor is causing the increase in output.  How?  My speculation is it increases the mid-range’s Q, which would increase low-frequency output.

2014.01.20 Right Mids Study - LowerThis result is shown above. The lower mid-range frequency response is flat up to the limit of close mic testing.  With the 2.0 mH inductor in series with the lower mid-range (blue line) the appropriate roll-off occurs and a +1 dB gain at low frequencies. (The upper curve is the difference between the two curves with and without the 2.0 mH inductor.) The data is from close mic with 1/6 octave smoothing applied. The drivers were outside of an enclosure mounted on Prototype #4’s baffle. Below is the same plot with the baffle mounted on Prototype #4’s enclosure. Note that now the gain at low-frequencies is +2.0 dB – mystery solved !!!

2014.01.20 Right Mids Study - In Box

Speaker III – Fixing A Resonance

Time to tackle the undesired resonance around 400 Hz which shows itself in both the impedance plot, the port output, and even the driver responses.  While reading Testing Loudspeakers by Joseph D’appolito, he described two projects where an imperfection in measurements similar to Speaker III’s was caused by cabinet bracing that formed double resonance chambers.  In both cases the bracing piece had small holes in them to allow air passage.  However, the holes ended up being acoustic masses because of their small size, creating resonances.  The solution in all cases was to enlarge the holes so that they did not act as acoustic masses.

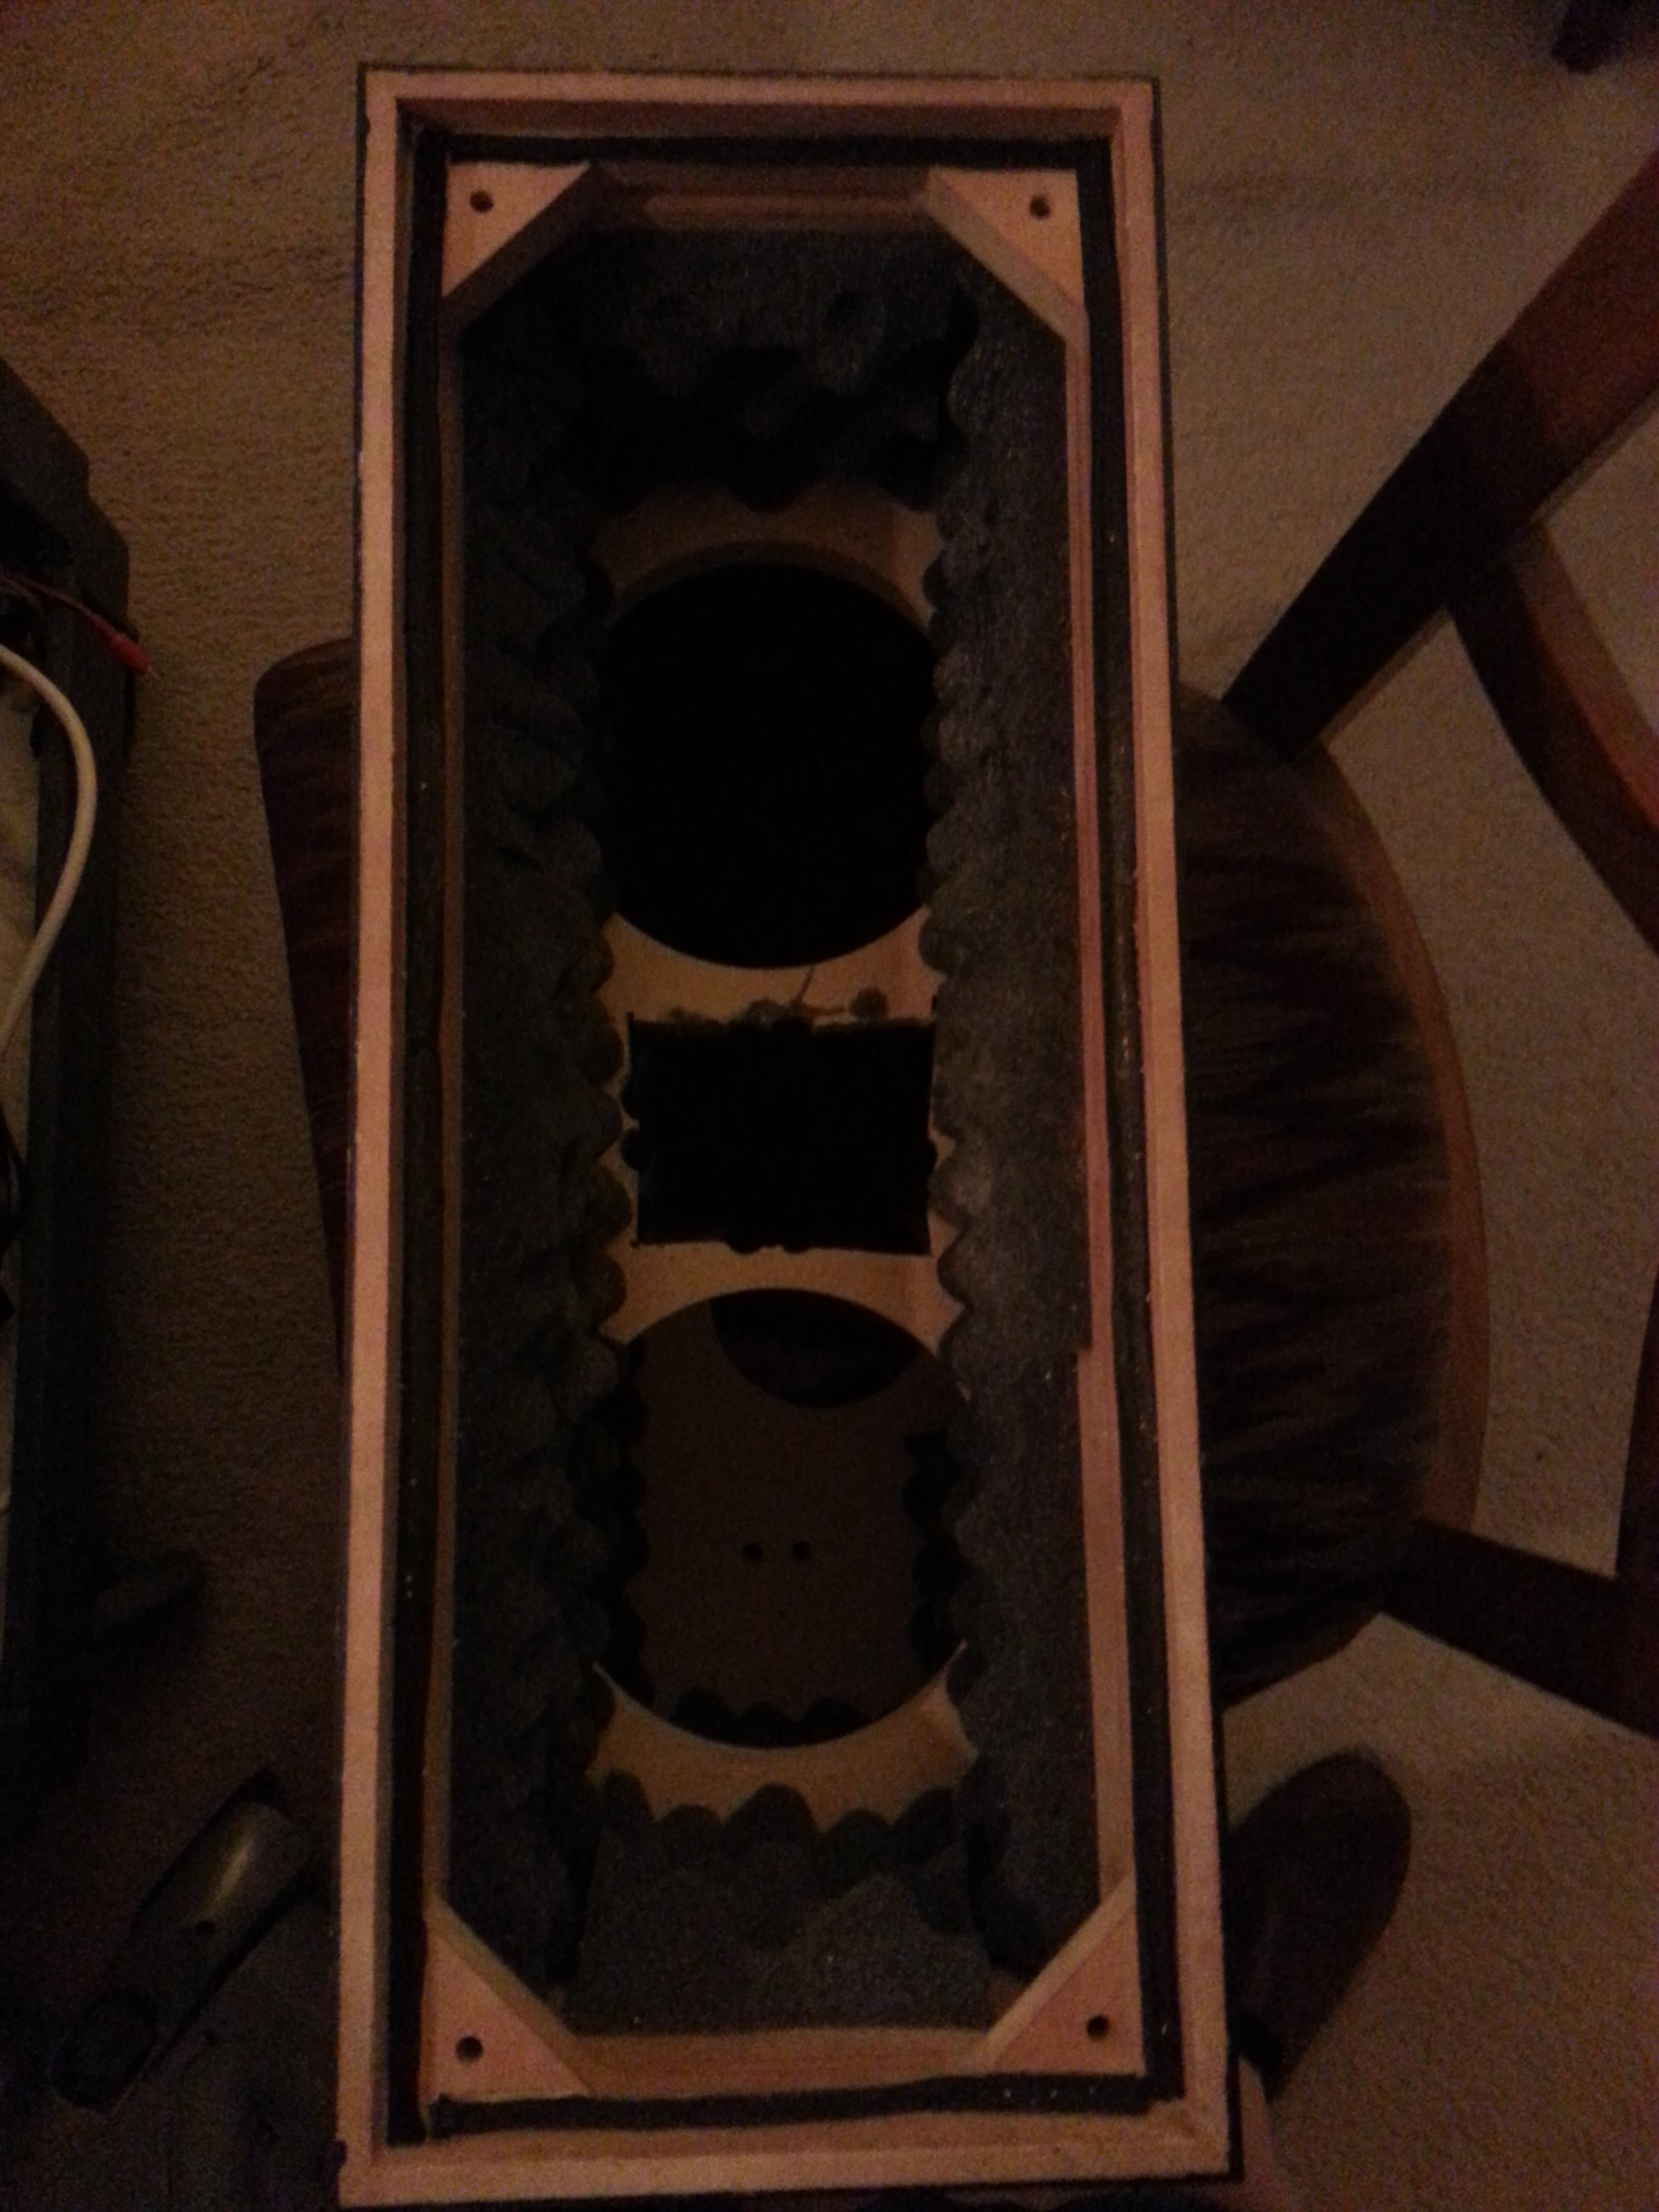
The Dayton cabinets have a vertical brace which has two perfectly round holes.  The holes are large, nearly the width of the cabinet, so I was skeptical that a double resonance chamber could be the issue.  Then I measured the port output.  Time to perform some cabinet surgery with the saws-all.  I cut an additional hole in the middle of the brace.

2014-01-11 18.12.53

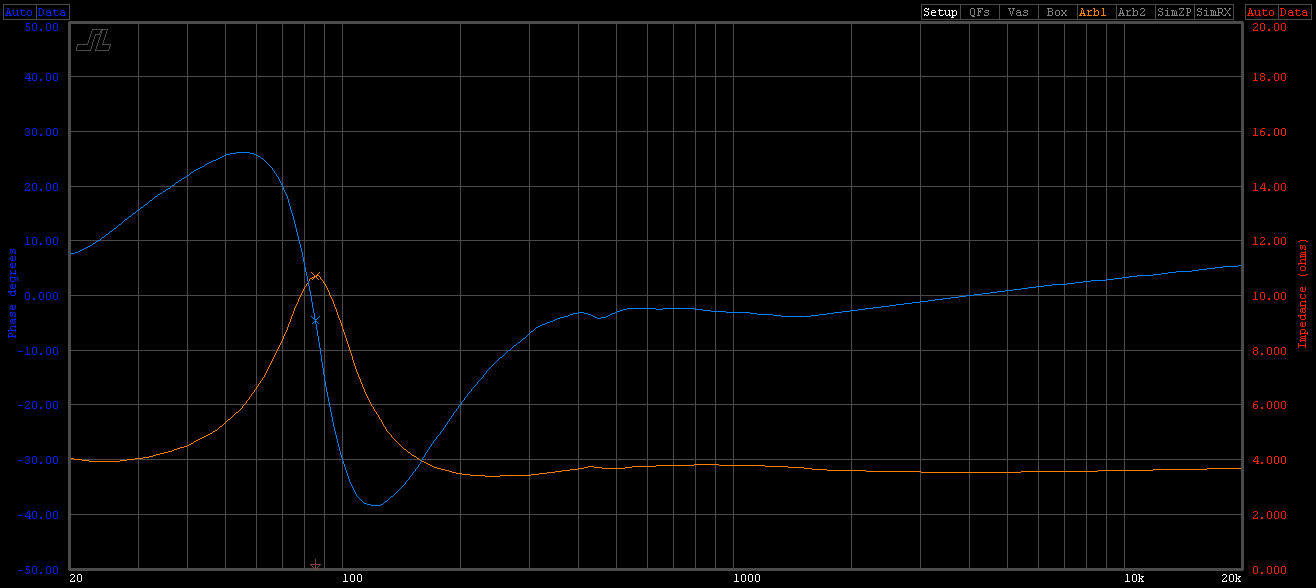
Next step, repeat all of the measurements.  First up is the impedance measurement.  Interesting, the impedance artifact is at a different frequency – 450 Hz.

2014.01.10 Spkr3 Left Mids Cut-brace

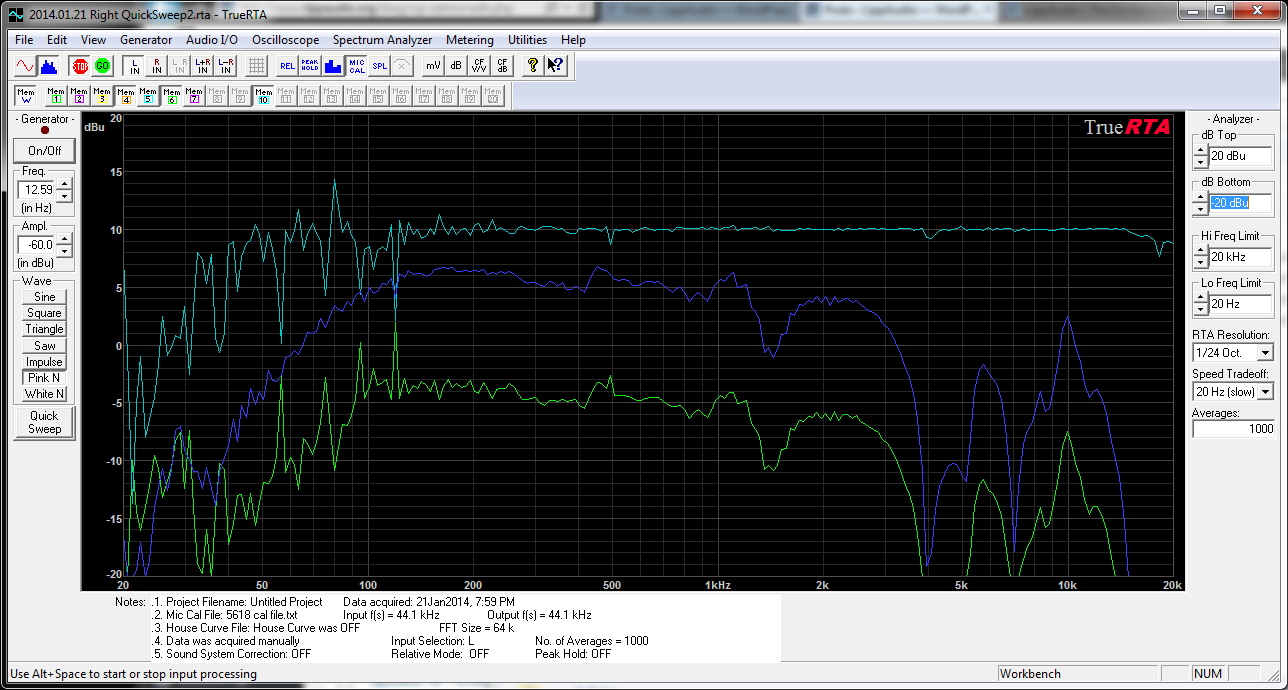
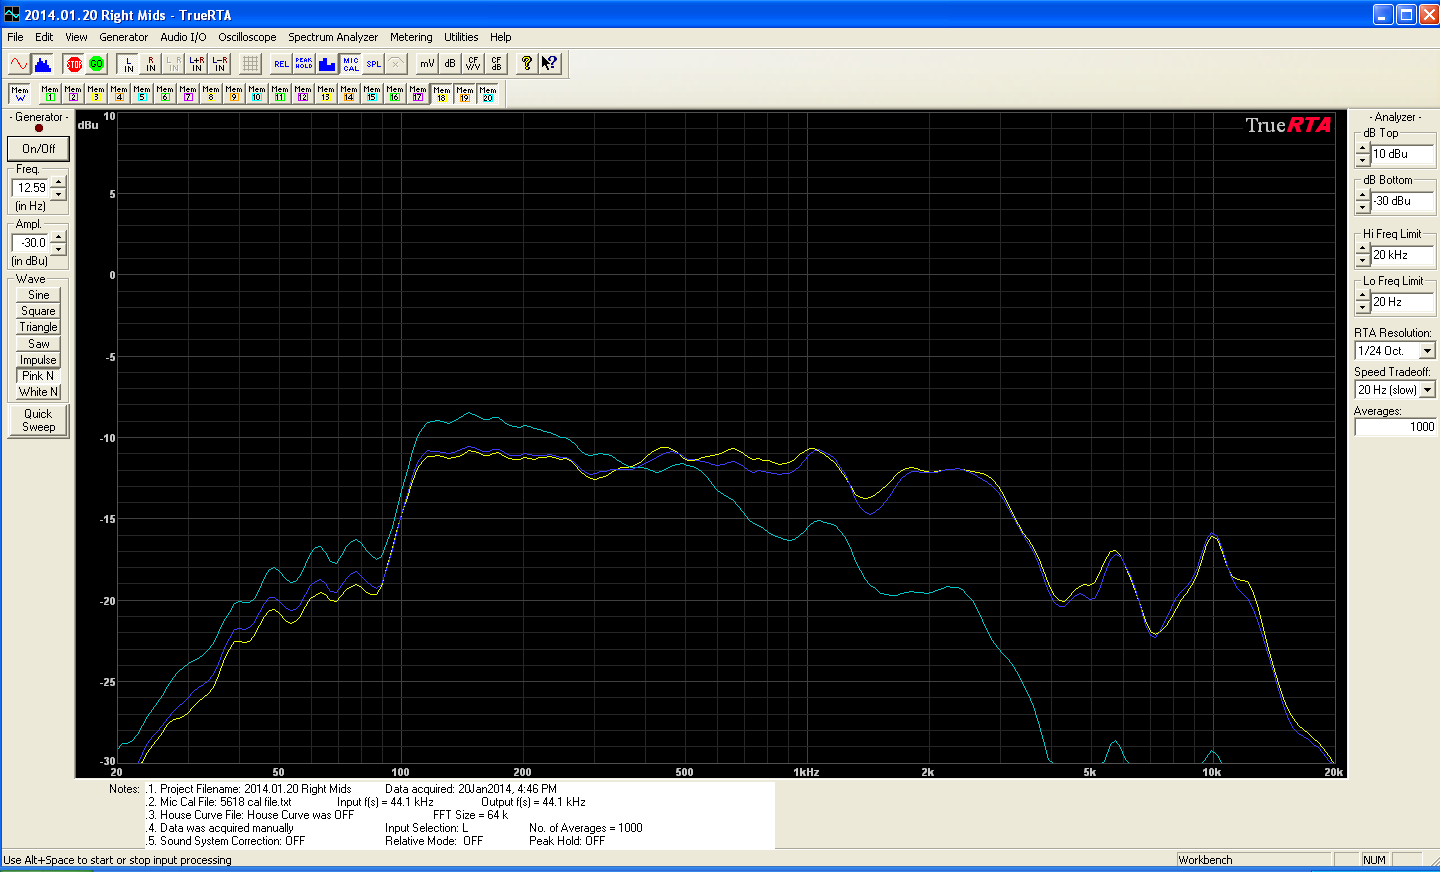
Here is the good news – before (green) and after (blue) port measurements.  Notice the 400 Hz peak is gone, replaced with a slight wavering in the port output between 400 – 500 Hz.  Yes!  Also notice a few other changes… the port tuning has shifted up several Hz, and the pipe organ resonance is stronger than before.  The cause in both cases is the material removed from the brace was also in front of the port tube, increasing its effective length.

2014.01.14 Port Outputs