New Sub – B&C 18TBW100

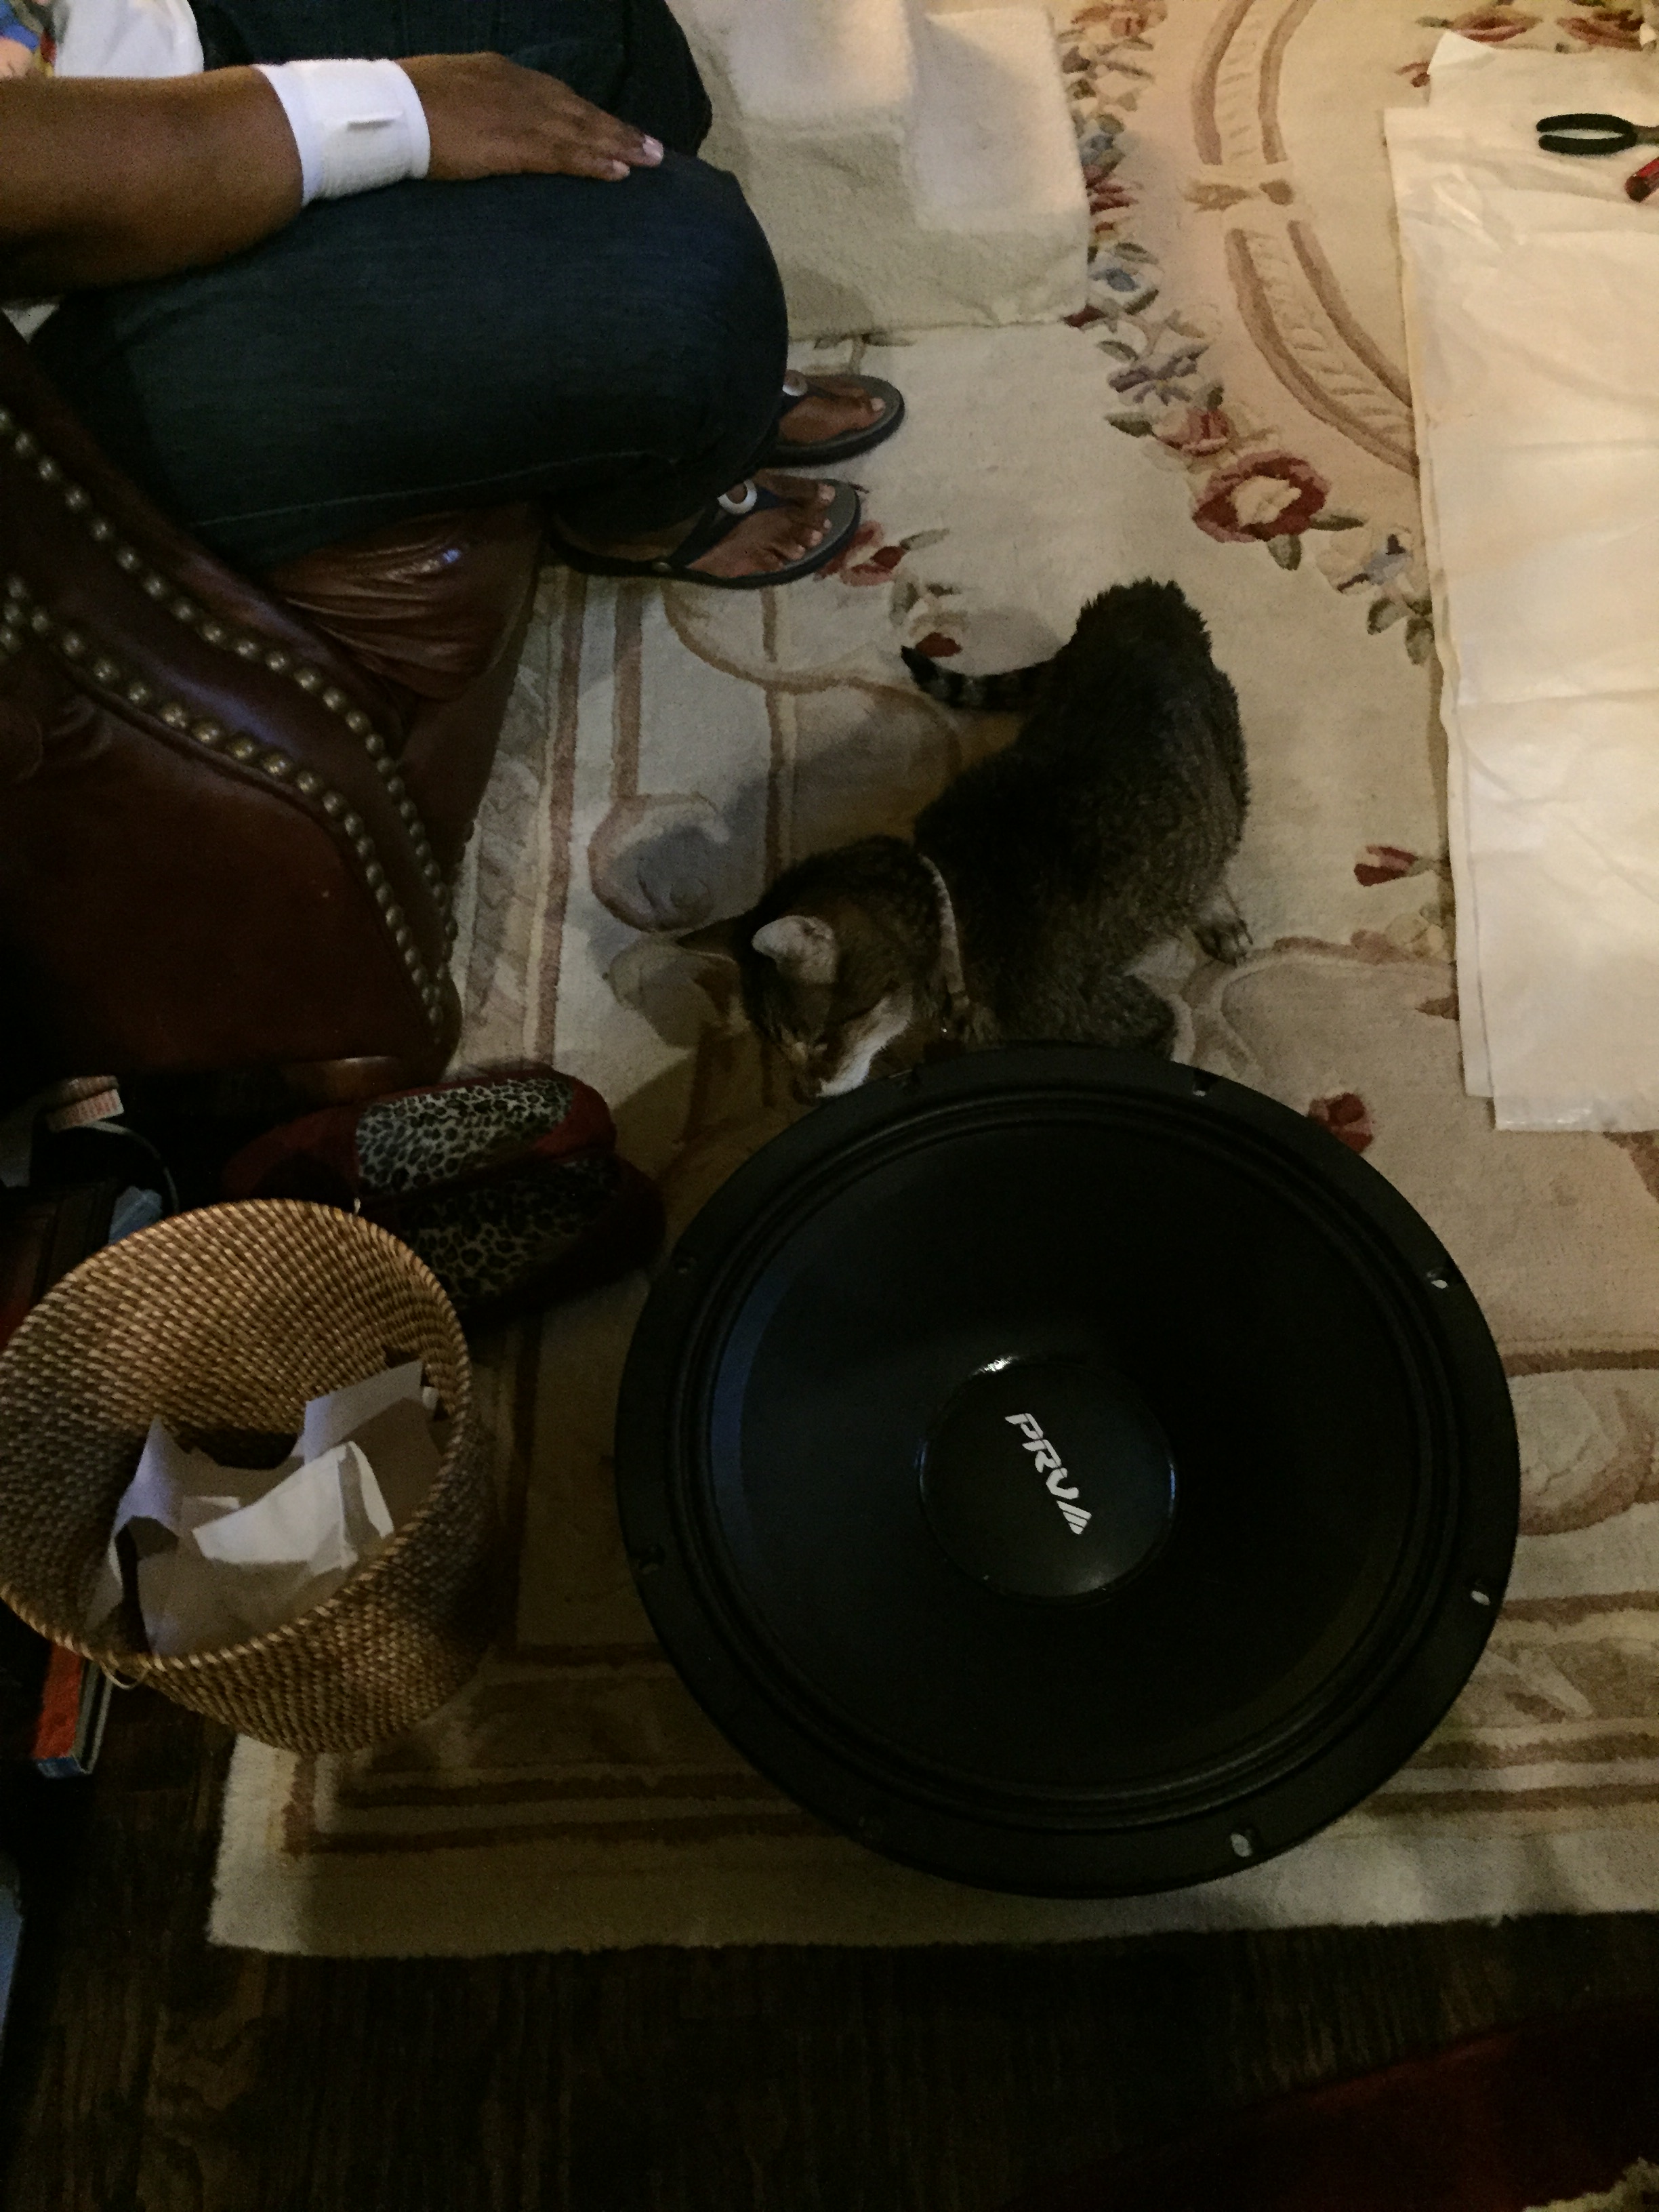
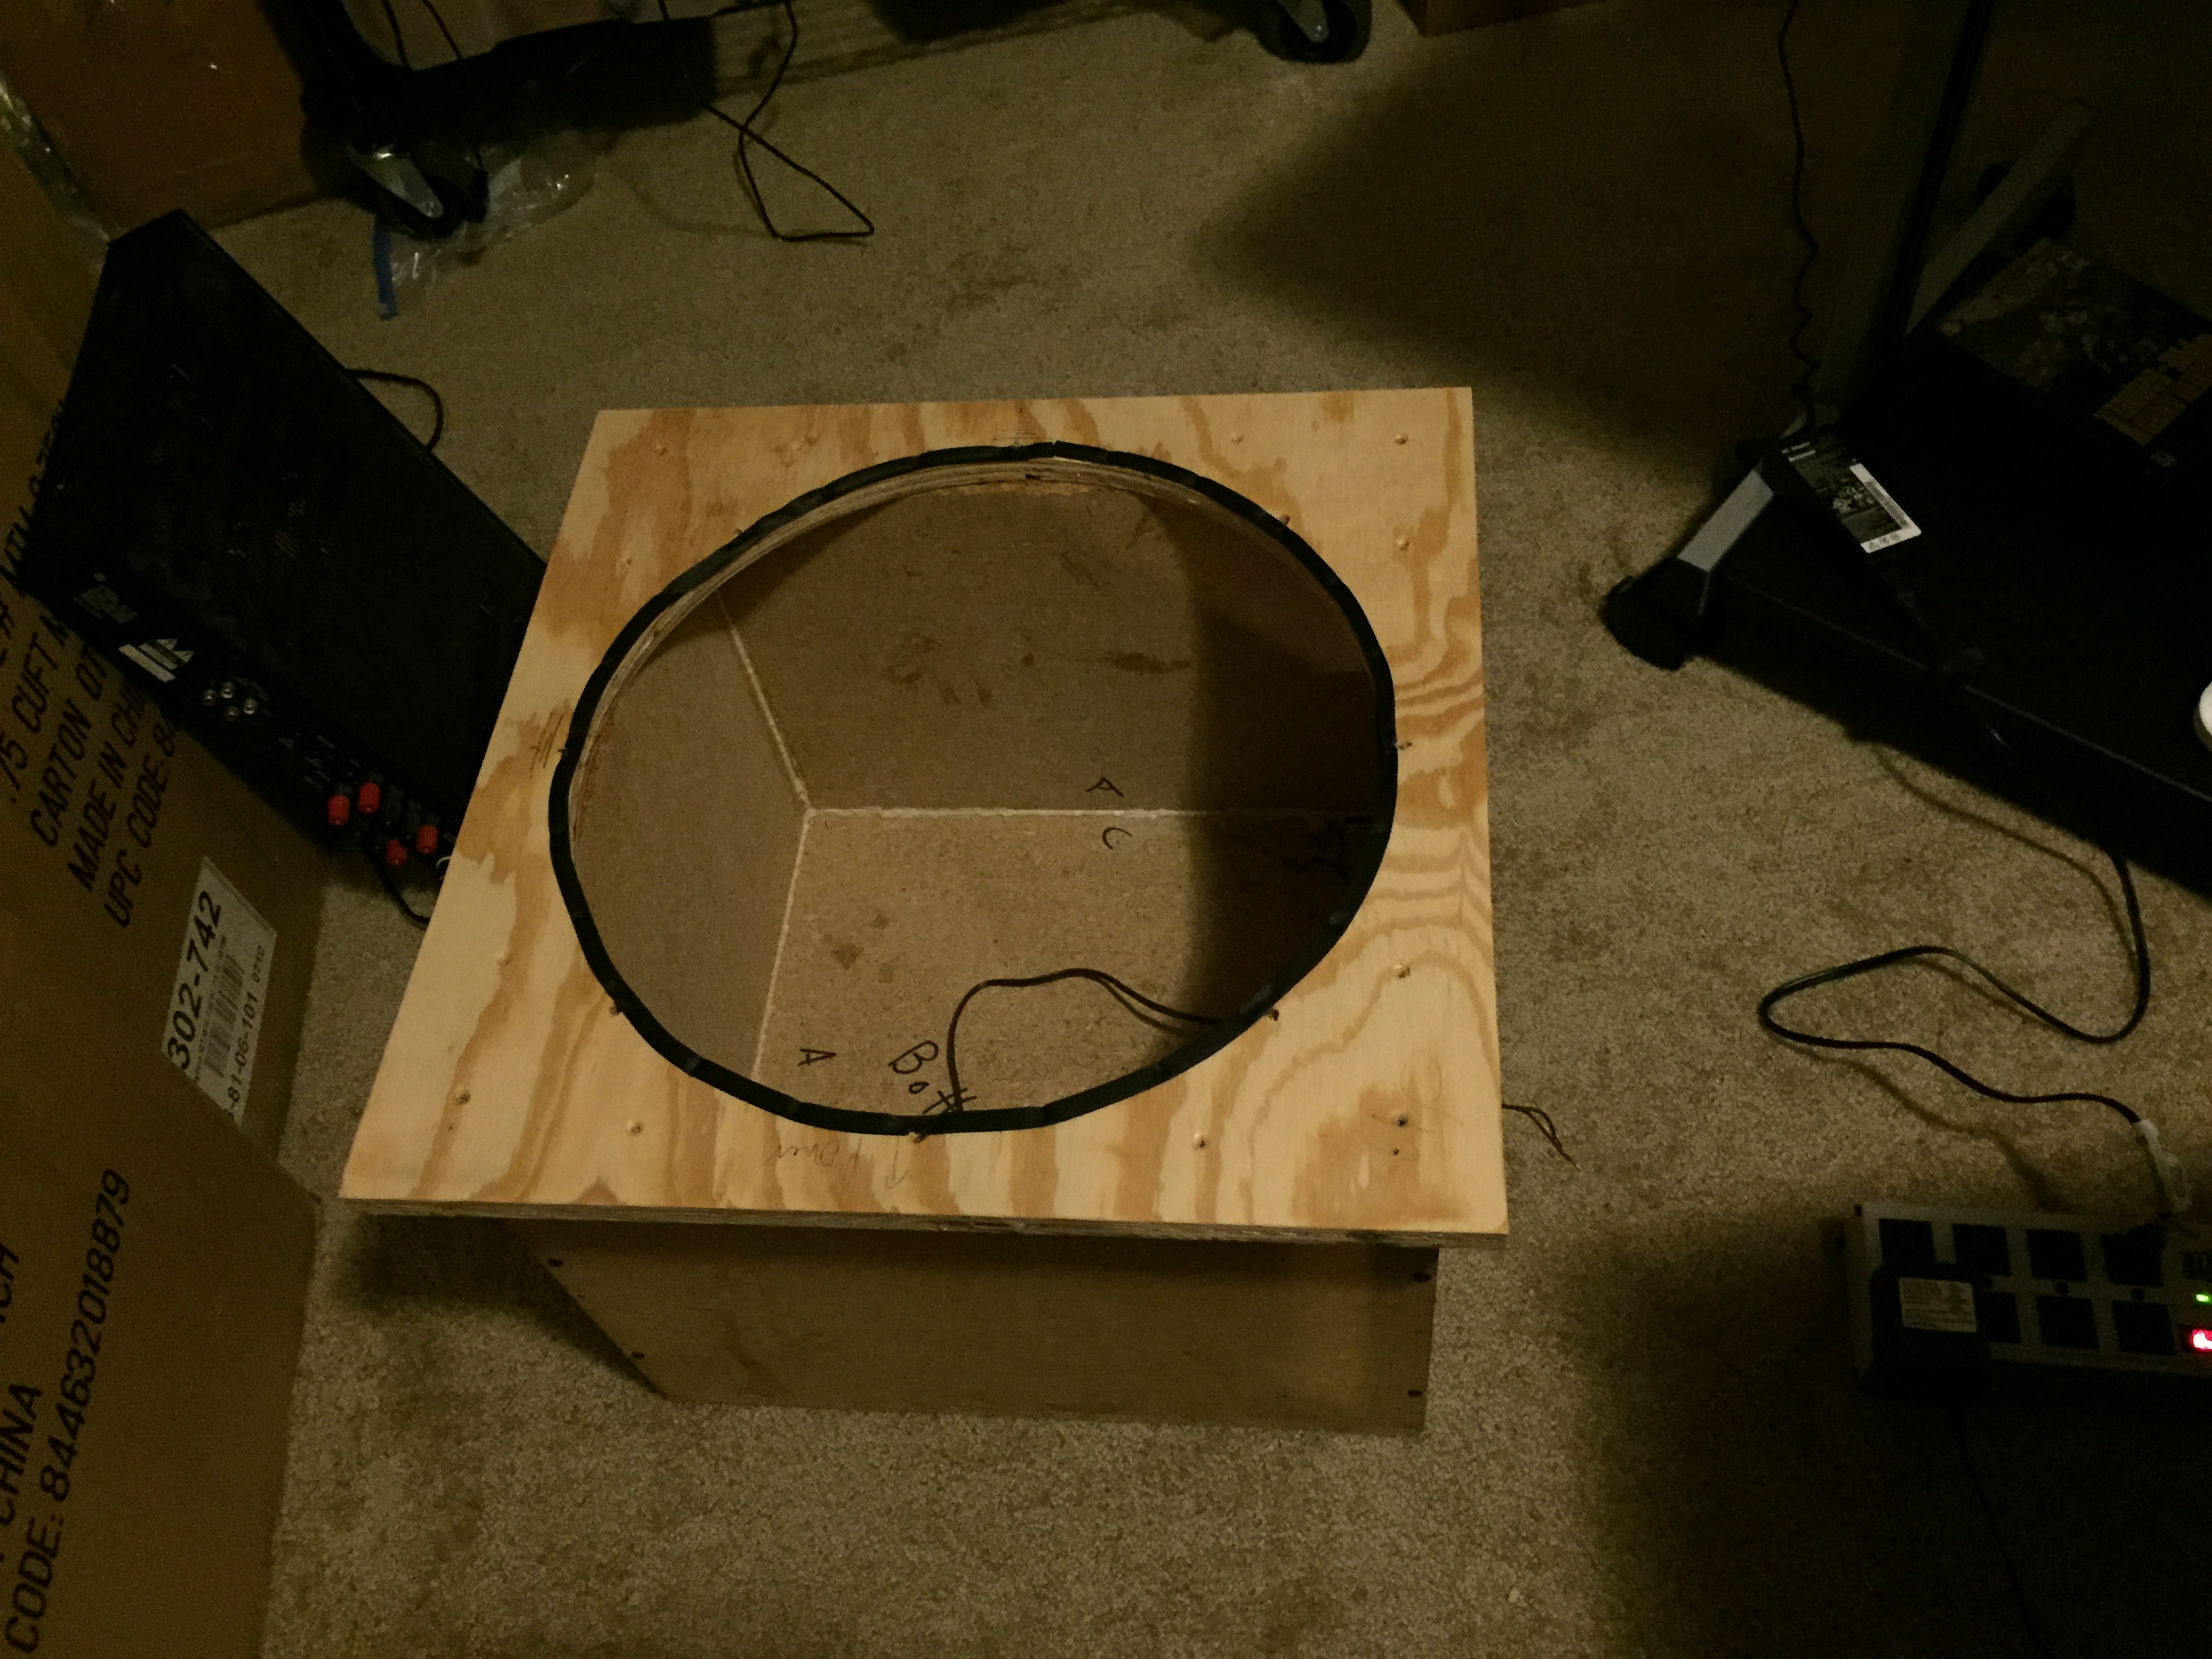
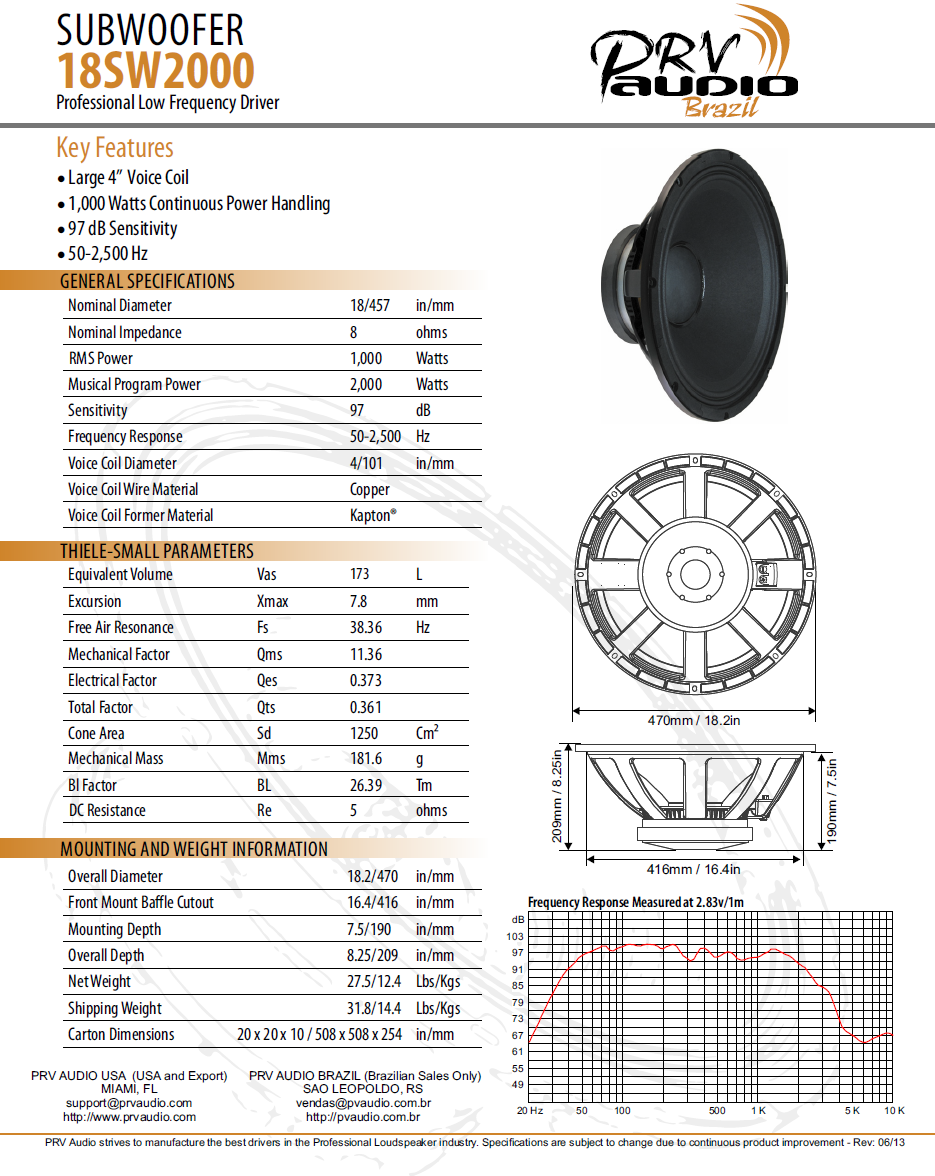
My instincts are telling me that the PVR Audio 18SW2000 is not going to work out for my project goals.  Not enough Xmax.  Not even close.  Also, the Vas is larger than advertised, the appropriate box for a Qtc of 0.707 is more like 3.0 cu.ft. and the fc will then be around 67 Hz.

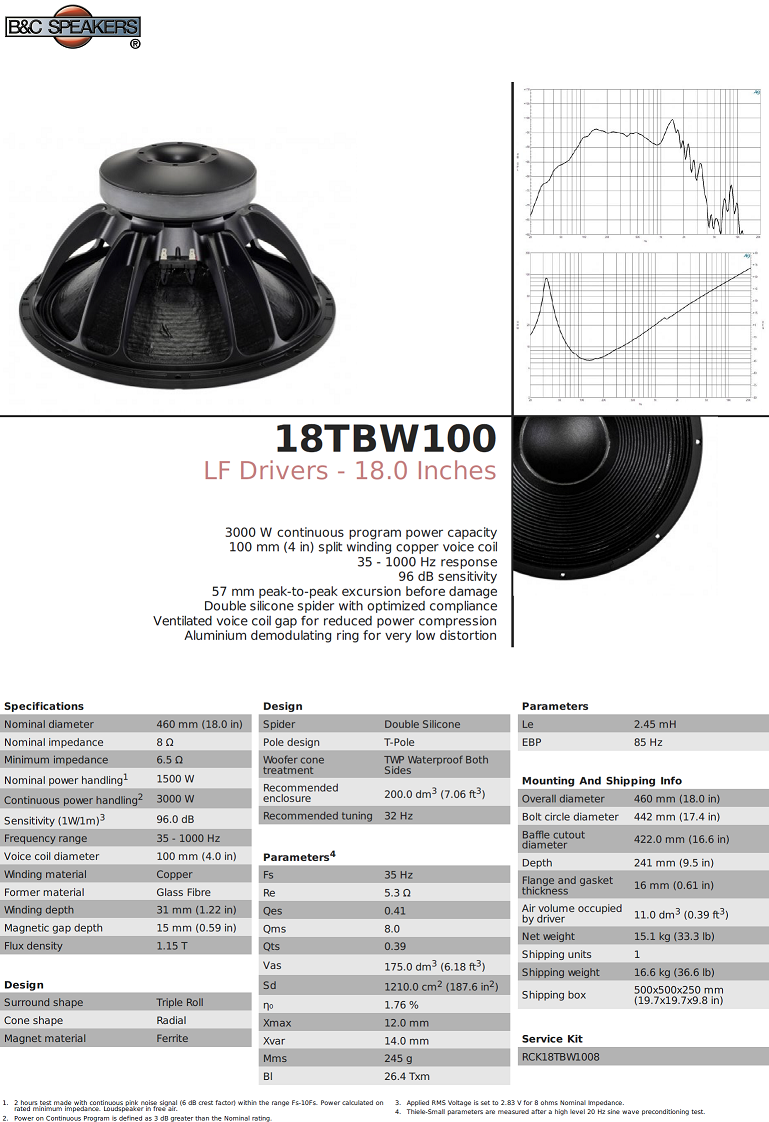
So I started looking for an alternative 18″ driver.  After reading various reviews, the B&C drivers looked like a good candidate.  Their 18TBX100 came out a few years ago.  Reviews consistently said “this is the 18″ pro sub driver to beat.”  Then B&C came out with the 18TBW100 to one-up their own accomplishment.  The spec sheet is impressive.  Mechanical limit is over +/- an inch without damage!  B&C also measures what they call Xvar, the point at which one or both of the suspension or magnetic circuit have diminished to 50% of the small signal values.  The magnetic circuit also has shorting rings so that high power levels don’t contribute as much distortion.  This is a feature I see in all the top tier sub woofer drivers – pro and home theatre.  The cost is double the PVR Audio 18SW2000… and I’m guessing its twice the driver.  Just what I need!

BnC 18TBW100 specs


New Sub – PVR Audio 18SW2000

So the PVR Audio driver showed up today.  Chester was interested in it of course, had to scent mark daddy’s new toy.

2015-10-11 19.16.18The first test is for basic Thiele-Small parameters.  I tried the test with the driver sitting on the carpet, but alas the magnet system is vented (for improved power dissipation) as shown below.  Blocking the vent causes the parameters to change due to the air flow restriction.

2015-10-11 19.32.57

The fix was easy… went to Home Depot and picked up some shelf brackets.  Mounted four of them and created essentially a set of stilts to raise the driver up.

2015-10-11 19.39.56

Parameters were measured with a small signal test.  To measure Vas a set of 16 nickels (80 g) were placed on the driver.  Results (compared to spec sheet):

  • fs = 33.0 Hz (vs.38.4)
  • Qts = 0.35 (vs. 0.36)
  • Vas = 246 liters (vs. 173)
  • Sensitivity = 97.6 dB (vs. 97)

Next, I tried to measure distortion.  The configuration is with the stilts above.  I wanted to look for the 10% level, since this is considered the maximum output level.  At a test tone of 50 Hz, the distortion reached this 10% distortion level with a 9.08 vRMS –> 10.3 watts into 5 ohms.  I used a displacement simulator and came up with only 1.76 mm peak one way.  That is only 25% of the rated Xmax!  Hmmm.  Could this be the room effect (the room has resonances at 34, 67, 102, etc. Hz) or operating in free air?

The later is a quick fix, I already had a 2 cu.ft. test box handy from my college days.  I made an adapter plate for an 18″ driver and repeated the 50 Hz measurement.  Distortion dropped to 3.34% at an input of 9.1 vRMS and an estimated displacement of 1.25 mm.  As I increased the volume my microphone pre-amp saturated and wouldn’t go any lower in volume.  So I switched to a 30 Hz tone.  The 10% THD level was reached at around 12.35 vRMS with 1.70 mm of estimated displacement.  Again, hmmm, not what I was expecting.

2015-10-11 19.33.23

New Sub

I wanna new sub, one that will make the earth quake, and my heart jump.  My current home theatre setup uses a pair of Velodyne MiniVee 10″ sealed subwoofers.  They aren’t too bad, but I never felt they did an adequate job of the last half-octave in the 20-80 Hz LFE range.

So how to proceed?  I have always liked sealed subwoofers.  That requires moving a lot of air, so why not an 18″ driver, the big boy?  I also thought the approach of Bagend to use a professional driver with electronic equalization was an interesting approach.  The sensitivity of pro 18″ woofers is in the 95-99 dB range compared to the 84-92 dB range for home theatre products.  The box size is kept reasonable by tuning to relative high frequency.  Electronic equalization is used to make up the difference.  In the case of Bagend, they equalize down to 8 Hz !!!  That’s really low, and from reviews I have read requires at least two 18″ drivers for a home theatre setup.  My goal is more modest, say 16 Hz would be nice, 20 Hz more realistic, with one 18″ sub.

So I started to poke around Parts Express and see what they had in the pro 18″ department.  The target was a box size of 2 cubic feet and a sealed Qtc of 0.707.  That put the cut-off frequency of 75-85 Hz for the candidate drivers suitable for a sealed enclosure (many pro drivers are designed for vented or horn enclosure designs).  A sealed enclosure rolls off at -12 dB for each octave, so the amount of equalization required would be expected to be +12 dB at 40 Hz and +24 dB at 20 Hz for a 64 Hz target cut-off.  That’s a lot!  Assume a 97 dB efficiency, then to operate at 100 dB would require about 2 watts above 80 Hz, and around 512 watts at 20 Hz by these numbers!  Assuming of course that the driver has enough Xmax.  That is around 8 mm of driver excursion for an 18″ driver.

One of the candidate drivers was on sale, the PVR Audio 18SW2000.  It would achieve a 82 Hz box tuning in 2 cu ft (actually a little less).  Xmax looks good.  Power handling more than enough.  The frame is cast, not stamped.  And did I mention it is on sale?

PVR Spec Sheet


Unbaffled

I purchased a set of BG 72″ ribbons quite some time ago.  I listened to them, but ended up putting them in storage as I didn’t have enough room.

2015-02-21 22.42.33

Now I am in a new house with a dedicated media room.  supporting equipment are a Musical Fidelity CD-PRE, a Musical Fidelity A3cr (for ribbons), an Anthem M20 (for bass), and a dbx 223 electronic crossover (set to 250 Hz).

The ribbons aren’t full range, so add to them four 15″ woofers per side in an unbaffled arrangement.2015-02-21 22.42.56

Speaker III – The Finale

2014.03.21 New Seas left vs. right

After further listening and testing, the tweeter appear to be just a little too bright.  Above is a 1/6 octave smoothed measurement at 18″ (this distance compares well to measurements at 36″, only with better signal-to-noise).  Both left and right speakers are measured.  Below is the left speaker and the tweeter, smoothed to 1/3 octave.  It looks like about 2 dB more tweeter attenuation should even things out, which brings the total tweeter attenuation to -5.5 dB.

2014.03.21 Twtr too hot

The final result, smoothed to 1/6 octave:

2014.03.22 twtr m5p5


Speaker III – Tweeter Zobel?

So I have noticed during testing that, when I add a second order time delay network between the tweeter and the cross-over, the response above 10 kHz changes.  That doesn’t make any sense at all – the time delay network should only change the phase.

The blue line below is the starting point of this experiment, and the yellow line represents the “solution” to this dilemma.

TD2 with&without zobel

The solution?  Adding a Zobel to the tweeter to bring down the inductive rise in impedance.  How much of an impedance rise?  Almost nothing!

Seas with zobel

Maybe there is something else going on… I measured this multiple times and obtained the same result.  Measurement conditions?  The mic is 6″ away, output level set to -31 which isn’t too loud, no indication of overload on the mic pre-amp.

Speaker III – Seas Tweeter Integration

SpeakerIIImkIIxover

For this test the woofer cross-over is fixed.  The lower mid-woofer has a 2.0 mH inductor in series, the whole connected in parallel with the upper mid-woofer.  Then an electrical second order cross-over composed of a 1.1 mH inductor and 15 uF capacitor, the cap is in parallel with the mid-woofers, the inductor is in series.  Comparing to the target of 2.5 kHz (in figure below) shows that the x-over frequency is just a little low.  So change the inductor to 1.0 mH.  (Measurement distance is at 36″.)

2014.03.09 Mid vs. target

For the tweeter a 2nd order electrical crossover also is appropriate to reach a target 2.5 kHz LR4 crossover.  The series capacitor value is 8.2 uF with a 0.2 mH inductor in parallel with the tweeter.  Notice that the match to the target is excellent to about 1 kHz, and then below that the tweeter level slope appears to change from 4th to 3rd order.

2014.03.09 Seas x-over vs tgt

The final integrated result.  The tweeter is -5.5 dB, set by a parallel resistor of 7 ohms + series resistor of 1.5 ohms.  (Measurement distance is 36″.)

2014.03.09 Combined twtr m5.5

Speaker III – Zaph ZA14W08 5″ Mid-Woofer

Ok, major change in direction.  The Vifa mid-woofers have not held up well while in storage.  Resonance and Qts have increased, implying that the suspension has undergone major changes.  Into the trash they go.  Sigh.

Welcome aboard the Zaph Audio ZA14W08 available at Madisound !!!  Not quite the same form factor, so new cut-outs are required.  And while I am at it, lets change to a matching metal dome tweeter, the Seas Prestige 22TAF/G (H1283).

2014-04-20 19.25.43 Spkr3 II front cropped

The cross-over design will be a 2.5-way.  Shown below is the 2 mH inductor on the lower woofer.  The two woofers are then wired in parallel.  You can also see an initial tweeter circuit (more details in the sequel).

2014-04-12 17.37.11 Spkr3 II inside croped

Some measurements.  Blue line is the raw drivers, green is with first prototype cross-over.  The cyan line is the cross-over target of 2.5 kHz LR4.  Notice the metal cone resonance exactly where its suppose to be.

2014.02.14 Spkr3 Zaph Mids w xover1

Speaker III – Output Conundrum Solved

Image

Today’s lesson is in INPUT SATURATION.  Yep, during the close mic testing I was saturating the A/D input.  This is what caused the strange differences in lower vs. upper mid-woofer 🙁

Below is a close-mic test without saturation.  The output level on the signal generator are separated by 10 dB.  The cyan line is the difference, showing that the difference is +10 db above 100 Hz.  Below 100 Hz the ambient noise on the lower volume recording interferes with the test.

Test2 m45 vs m55

Now raise the signal level by 10 dB as shown below.  No need to take a difference, the blue curve is clearly not 10 dB greater than the green line.

Test2 m35 vs m45

Speaker III – Output Conundrum

Multiple close mic measurements on the mid-ranges have showed the same phenomenon over and over again: the lower mid-range has greater low-frequency output than the upper mid-range.  About 2 dB more output, which is significant!  I would expect less output from the lower mid-range given that it has a 2 mH inductor with a significant DC resistance.

The first test is comparing each mid-range’s TS parameters.  The results are the upper mid-range efficiency is +1 dB over the lower mid-range!  A close mic of the two mid-ranges with the 2.0 mH inductor removed show they are within 0.5 dB of each other.  Hmmm.  Retest with the 2.0 mH inductor on the lower mid-range and voila!  The inductor is causing the increase in output.  How?  My speculation is it increases the mid-range’s Q, which would increase low-frequency output.

2014.01.20 Right Mids Study - LowerThis result is shown above. The lower mid-range frequency response is flat up to the limit of close mic testing.  With the 2.0 mH inductor in series with the lower mid-range (blue line) the appropriate roll-off occurs and a +1 dB gain at low frequencies. (The upper curve is the difference between the two curves with and without the 2.0 mH inductor.) The data is from close mic with 1/6 octave smoothing applied. The drivers were outside of an enclosure mounted on Prototype #4’s baffle. Below is the same plot with the baffle mounted on Prototype #4’s enclosure. Note that now the gain at low-frequencies is +2.0 dB – mystery solved !!!

2014.01.20 Right Mids Study - In Box