Finally getting comfortable enough with the Room Equalization Wizard software to start some serious testing. Another audiophile has set the bar high – Zaph Audio. He has done large tests of tweeters, mid-ranges, and woofers. One of his claims is harmonic distortion is a key discriminator in the sound of speakers and their drivers, and is an important factor in setting the cross-over frequency. So my goal is to mimic his methodology. Part of the Zaph Audio approach is consistency – testing all of the drivers using the same process. So even if it turns out the process has some hidden defects, the ranking between drivers are likely to remain valid.
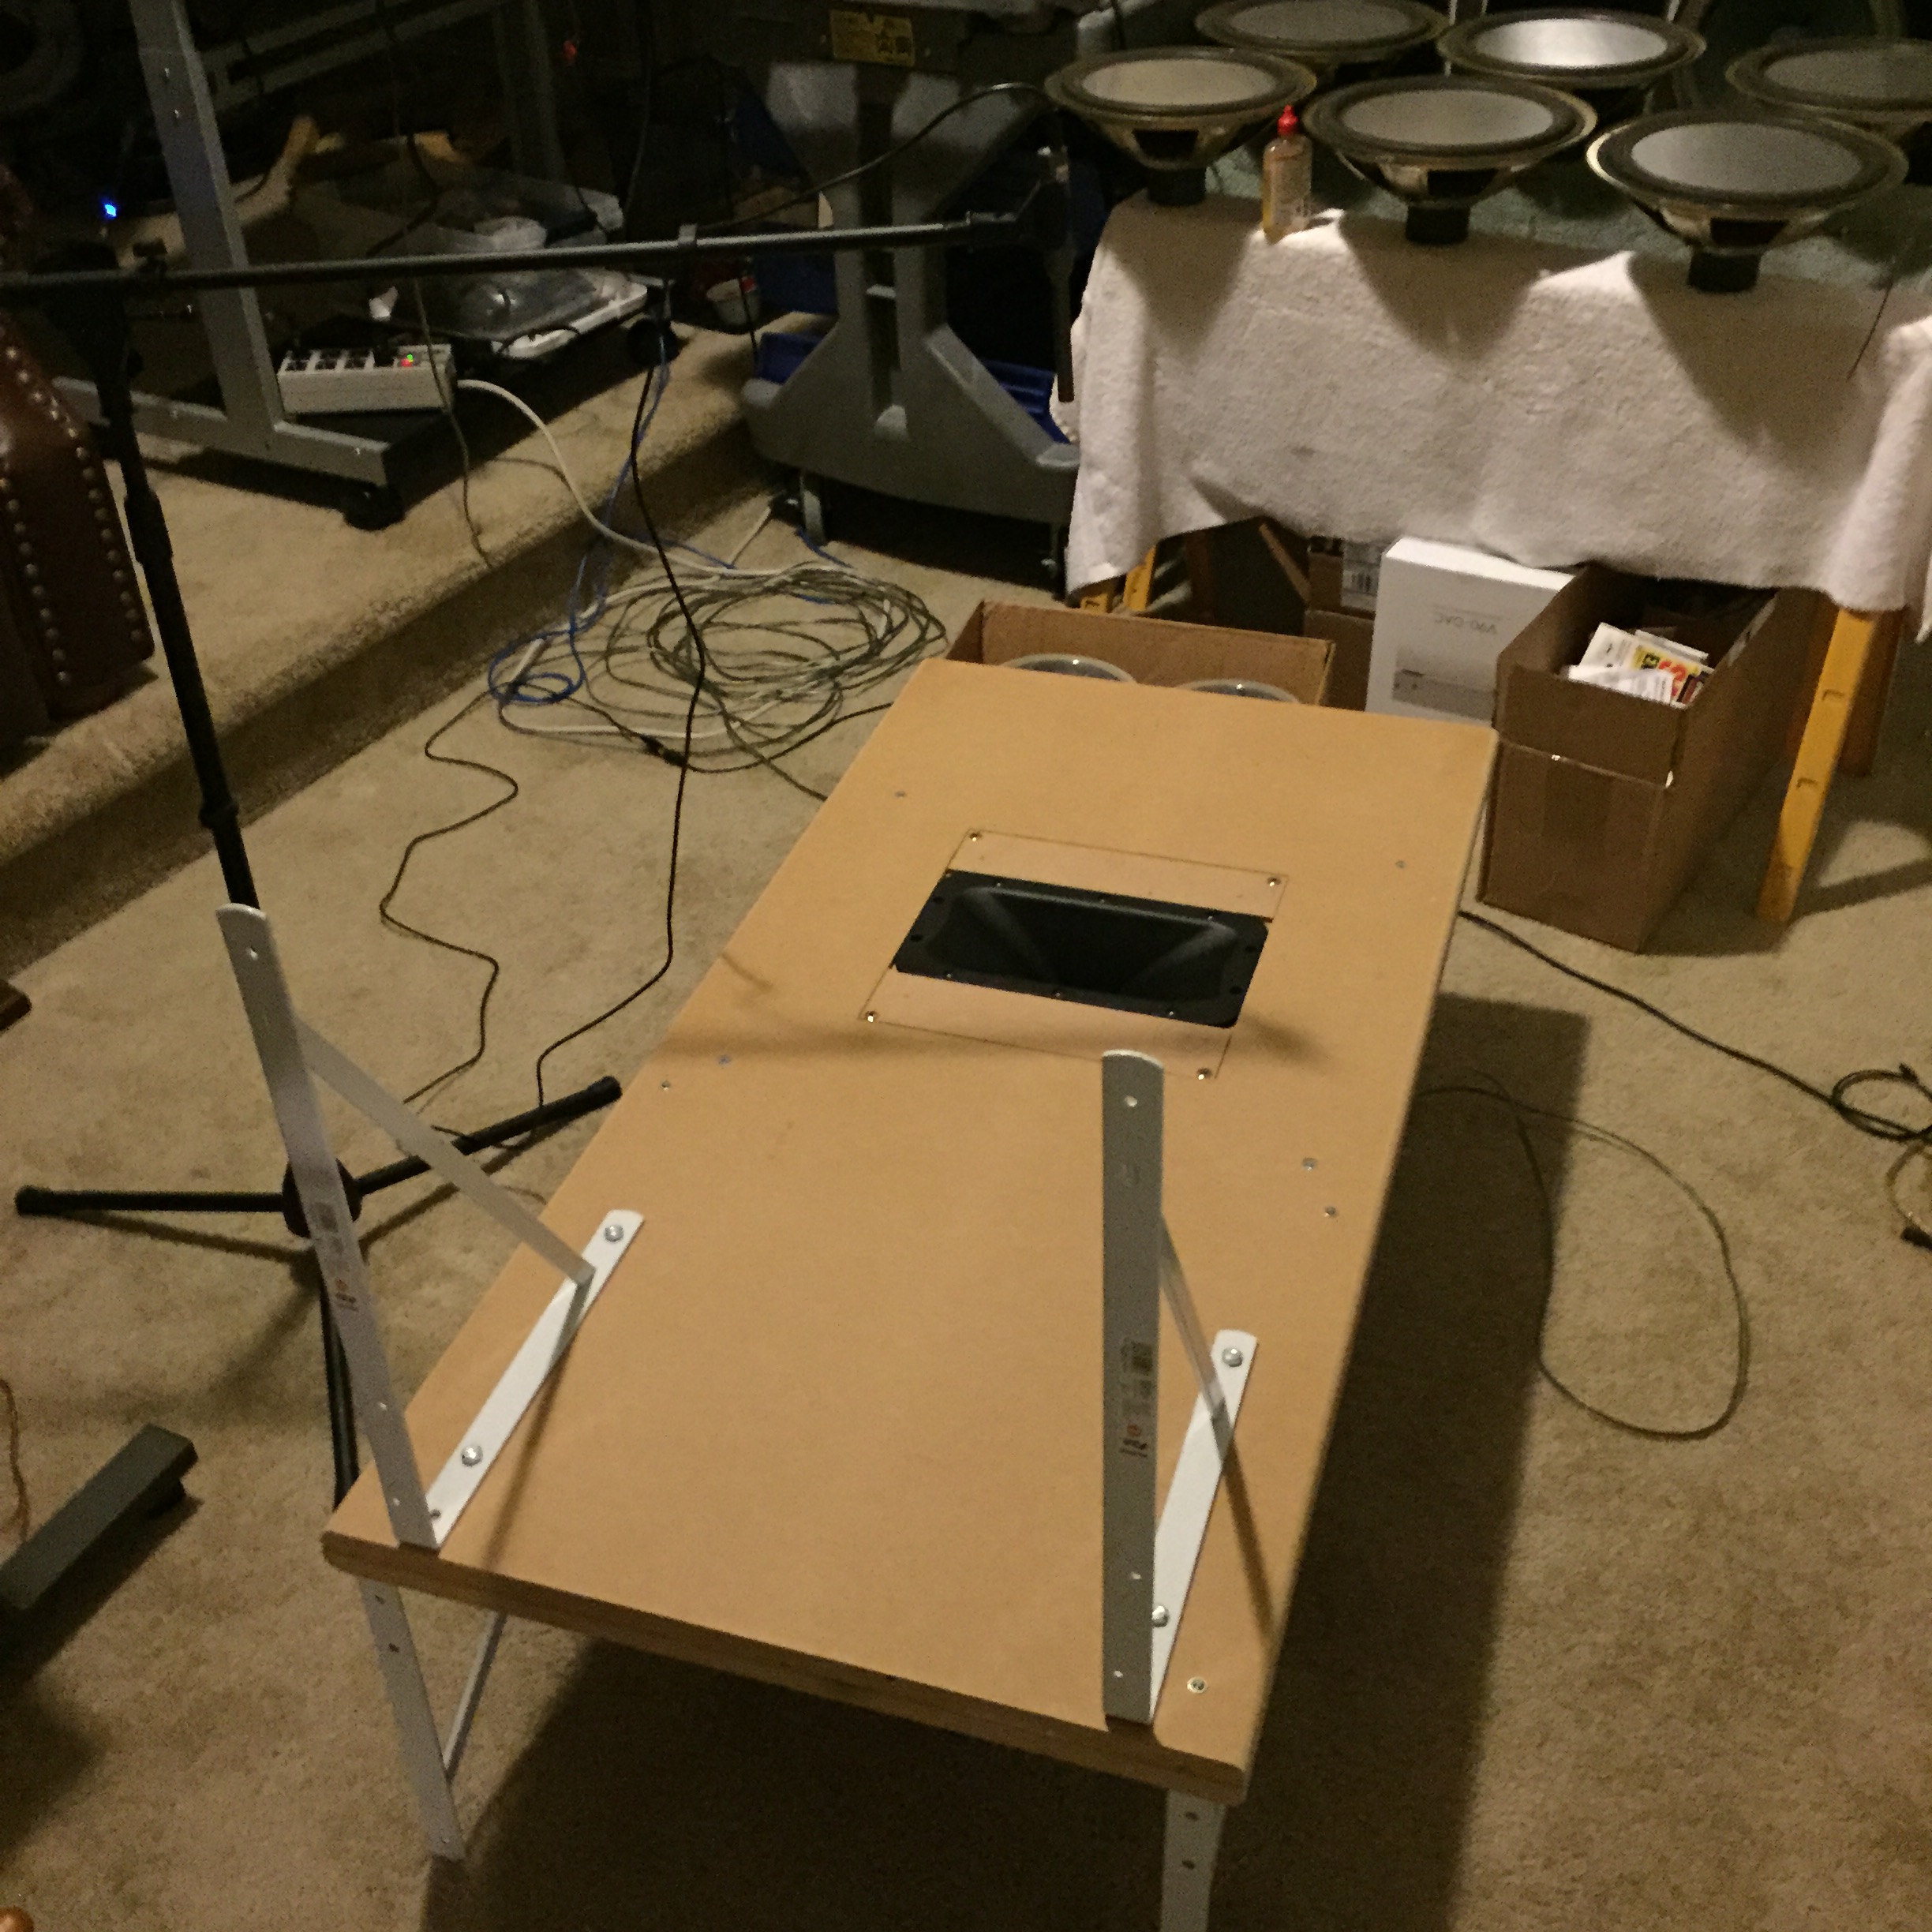
I started by building a large baffle with a replaceable 12″x12″ panel to which drivers can be mounted. Flanking on the left/right are two of the GIK Acoustics panels borrowed from the living room.
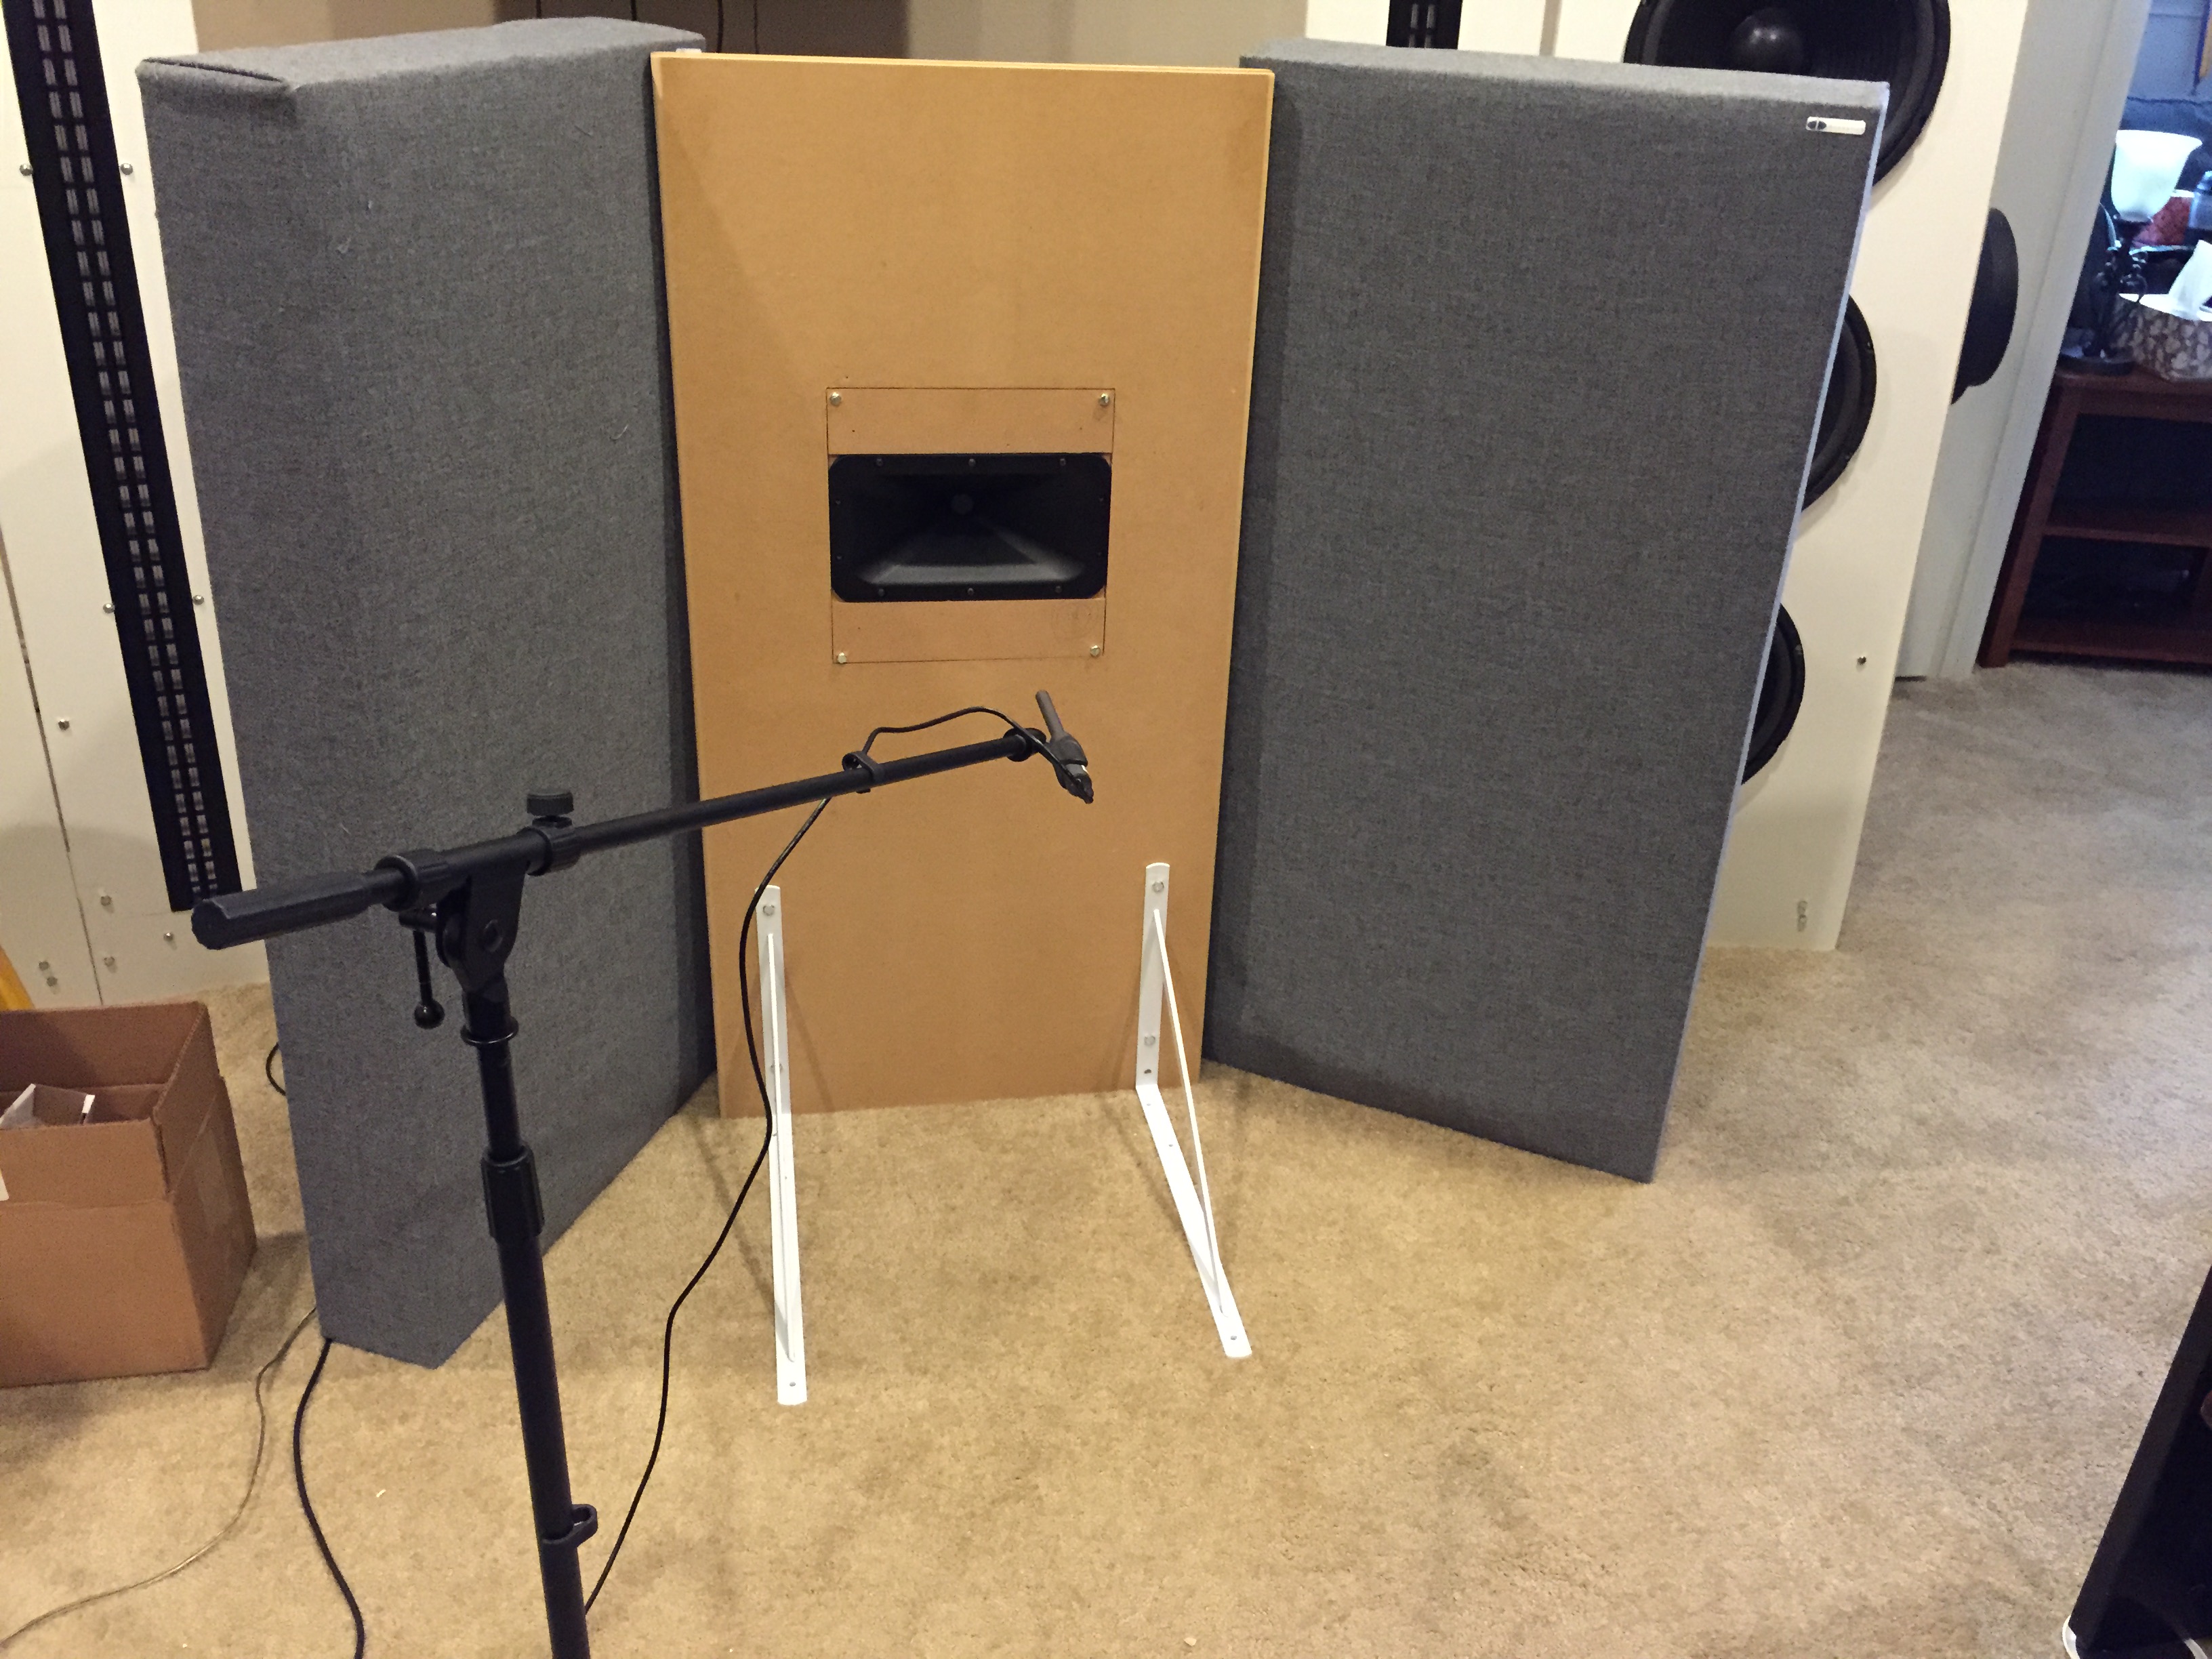
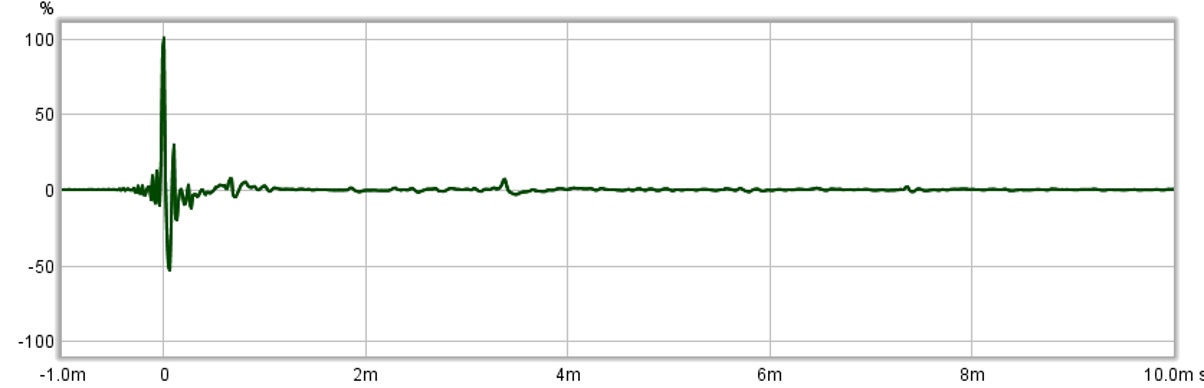
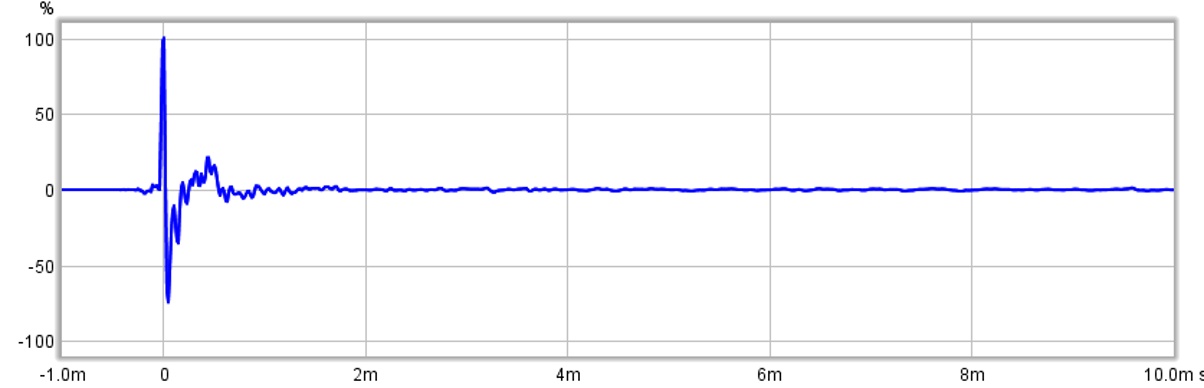
The problem with this setup is the reflection from the ground. The driver center is about 30″ above the ground, and the microphone is 18″ away. Doing some math, you can show that the round trip travel time will be about 3.85 msec for the ground reflection compared to the main impulse response. Here’s an example. Notice the “blip” at 3.85 msec?
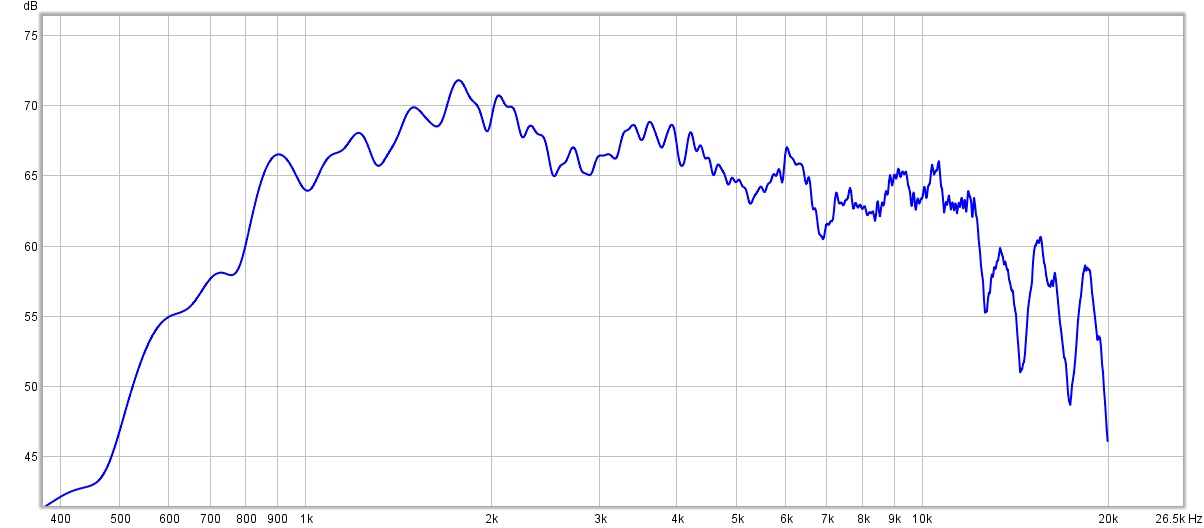
Why is the extra blip a problem (as well some other smaller, extra blips)? It distorts the frequency response calculation. Show below is the result with the full 10 msec of data:
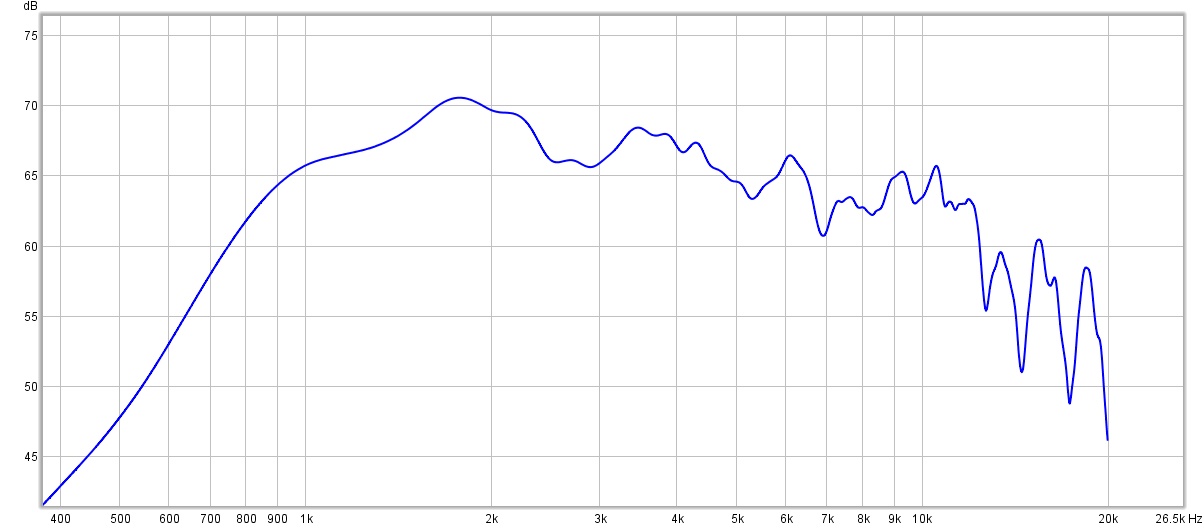
Next, with the data limited to a 3 msec data record:
So how to get a longer, clean data record? How about laying the board down so that the driver faces up? The ceiling is 10′ high in the room. There is a lot of equipment in the room which will generate reflections.
Here’s the resulting impulse response – clean for a full 10 msec! (Alright, not perfectly clean, but significantly better.)
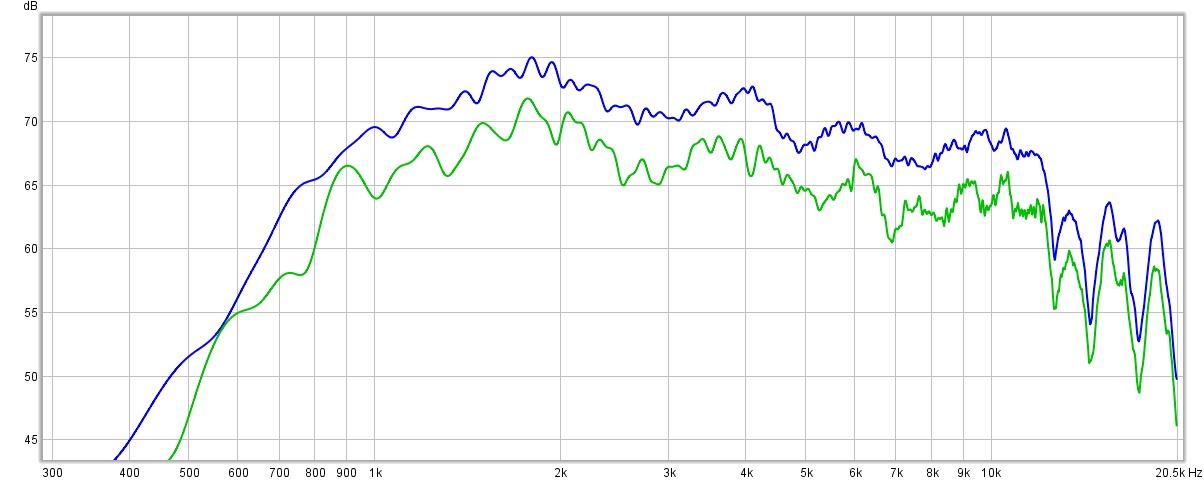
The resulting frequency response, compared with the upright measurement with a 10 msec data record. The imperfections in the curve – likely the result of the finite test baffle – are sharper and more exaggerated with the reflection present.
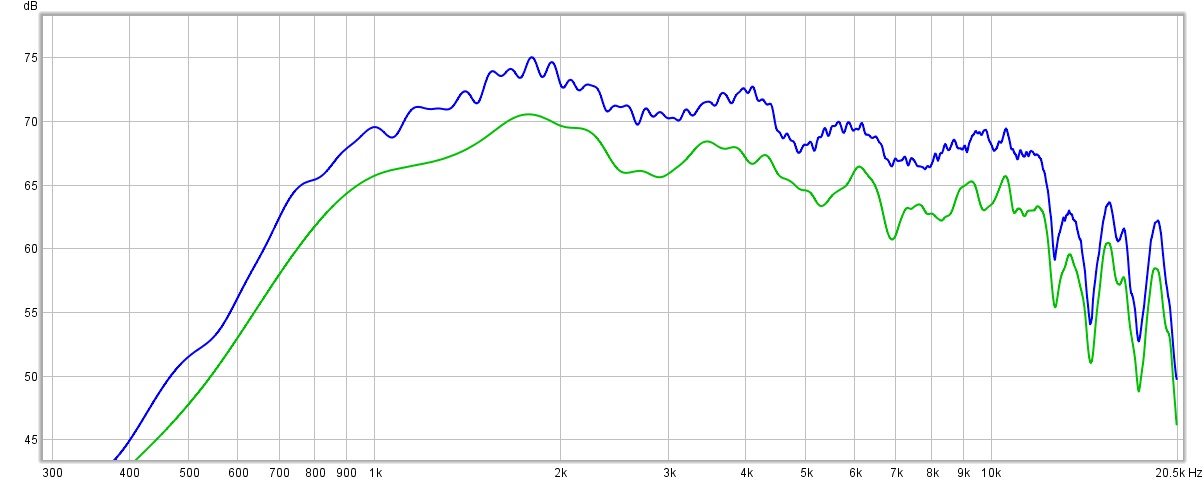
For completeness, repeat the comparison, 10 msec data record on the floor vs. 3 msec data record upright with reflection.
What else needs to be controlled? For the distortion measurements to be comparable, the input power should be set so the driver output is at a consistent value – I’ll use the same value of Zaph Audio of 90 dB at 1 meter.