Testing Methodology
 |
 |
 |
Shown above is the rather crude testing methodology that I began with. The white board in the first two pictures is a 40″ x 60″ foam board that can be found at any office supply store. It is about 0.2″ thick, so not particularly strong. I glued an additional piece of foam board on the backside to stiffen up the area around where I mounted the drivers. The last photo shows a double layer, 1.5″ thick “skinny” test baffle that I built, the stand for it, and two more 40″ x 60″ foam boards. The two white circles on the test baffle cover up the mounting holes
for the Vifa and Morel tweeters. All the tweeters were flush mounted for the tests, as was the mid-range.
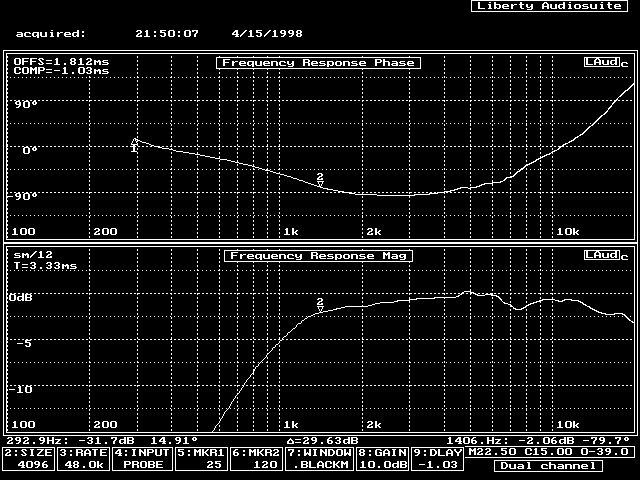
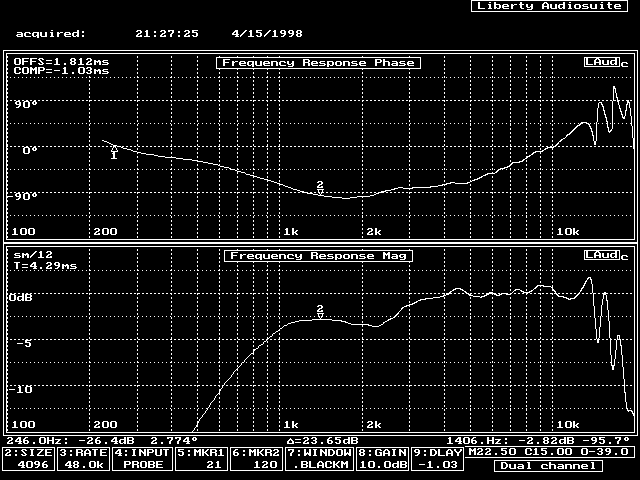
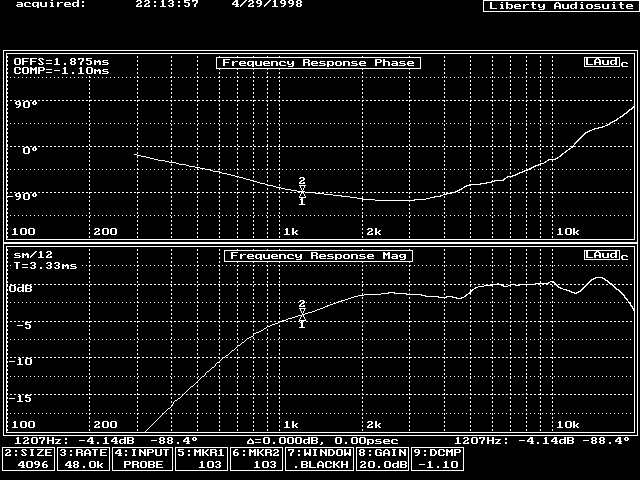
The frequency and phase responses shown below have to be taken with a grain of salt. Later testing showed that the foam board is at least partially acoustically transparent in the mid-range frequencies, and possibly has a mid-range resonance as well (see The Tweeters, Part 2).
By the time I made this determination, I had already returned the Focal tweeter, so I have not been able to verify which response artifacts are “real” and which are “foam board.” However, discussions with fellow speaker builders verified the Focal’s severe resonance problem above 10 Khz as real. Between that, the unit’s high price, and the poor arival condition, I incurred no emotional loss returning the Focals.
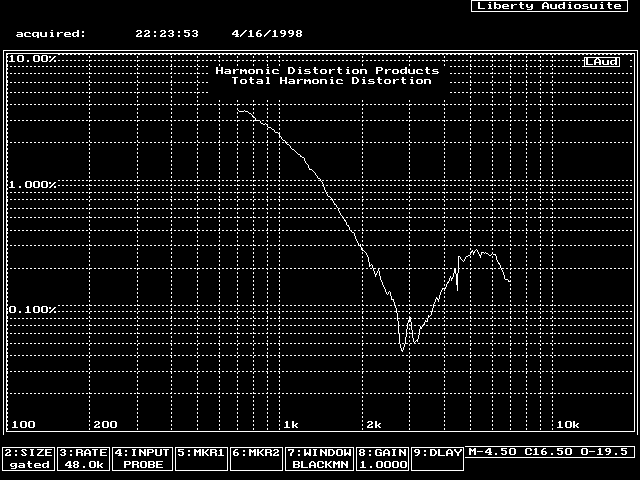
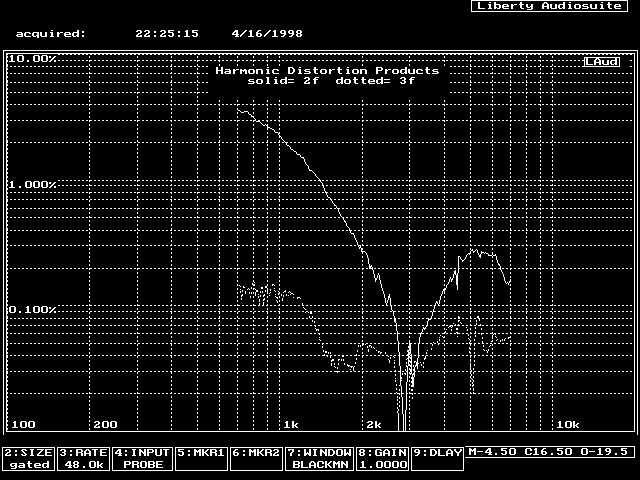
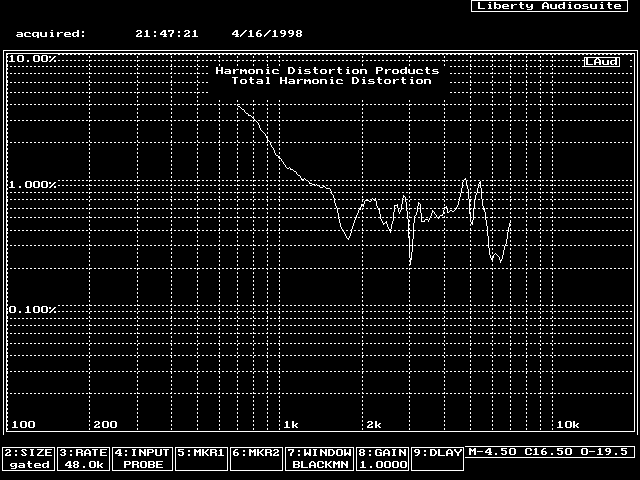
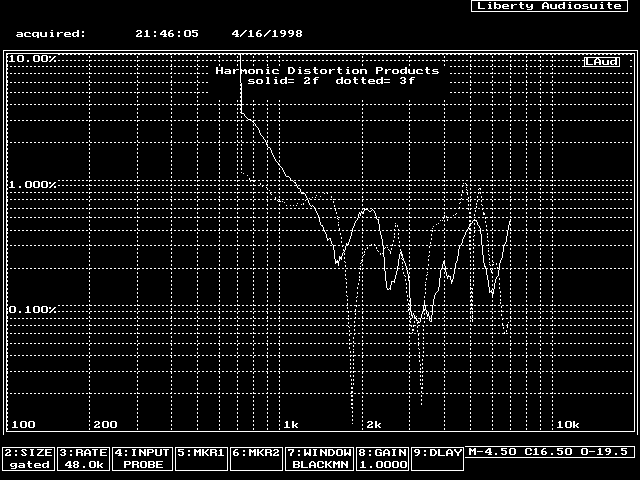
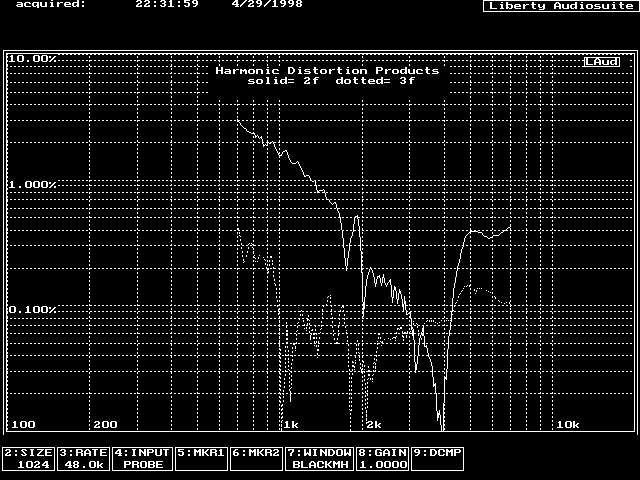
Distortion measurements were all made at a distance of less than an inch to maximize the number of valid data bits. Since the card’s sample rate is just over 40 Khz, 3rd order harmonic distortion measurements above 7 Khz were not possible, nor 2nd order harmonic distortions above 10 Khz.
Vifa D27SG-05 Tests
Frequency Response
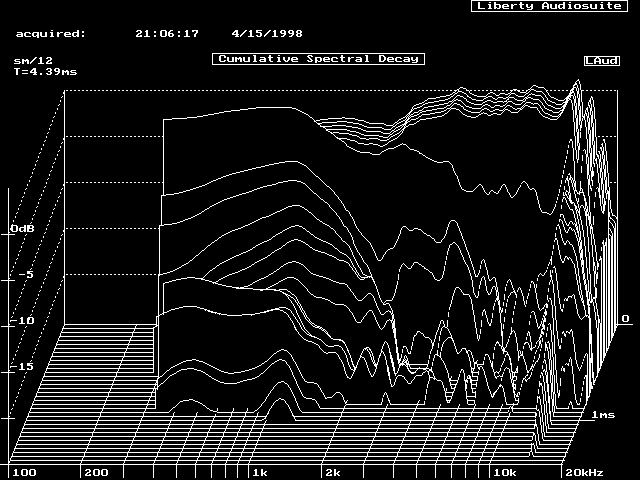
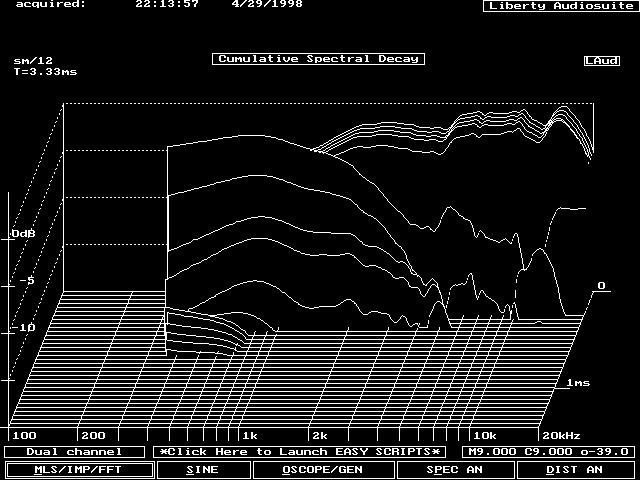
Waterfall CSD
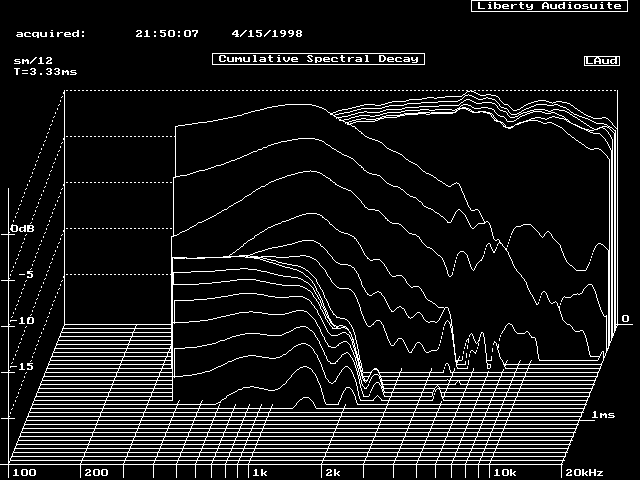
There is some activity associated with the response dip around 7kHz. This indicates some type of possible resonance behavior. As mentioned in the intro, this could be an artifact of the foam board.
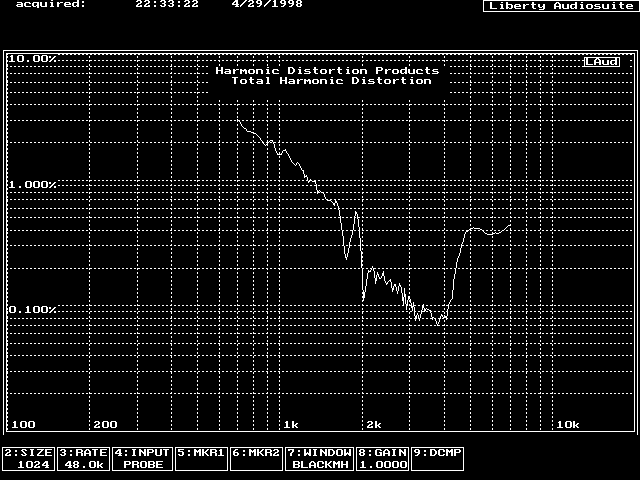
THD
Signal level of -19.5 dB.
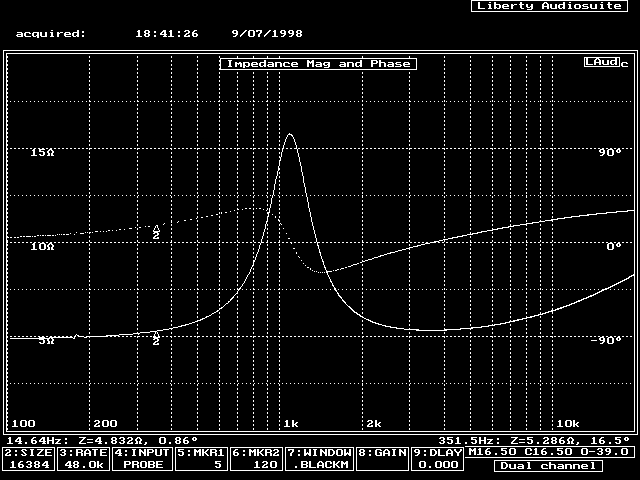
Impedance
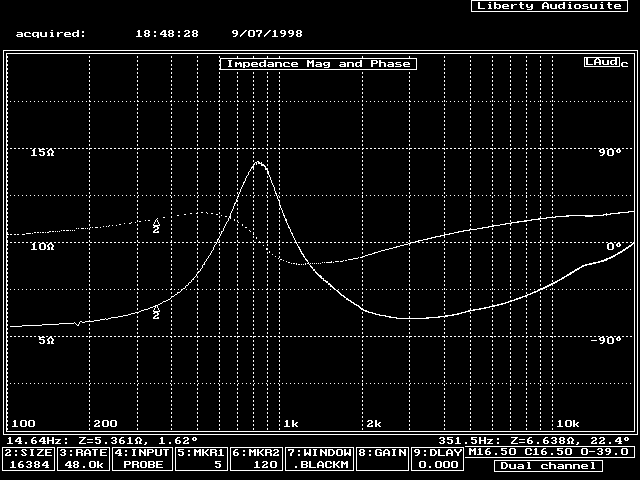
Signal level of -39.0 dB measured while on prototype cabinet 1. This is very smooth and does not indicate any resonance behavior as measured while on the foam board. This smoothness is possibly the result of ferrofluid’s mechanical damping.
Focal TC90KB
Frequency Response
Notice the dip at 2kHz, and the crazyness above 10 Khz. The dip at 2 kHz is present in Focal’s own response data, as is the wierdness above 10 kHz.
Waterfall CSD
Wow, look at the activity above 10Khz! This is pretty bad ringing.
THD
Signal level of -19.5 dB. Notice the Focal unit’s THD is evenly distributed between the 2nd and 3rd harmonics (plot 2 of 2). Both the Vifa and Morel units’ distortions are dominated by 2nd order distortion products. This characteristic is maintained at lower signal levels.
Impedance
Sorry, no impedance plot for the Focal. However, other data I recorded shows impedance anomylies at 2.5 kHz, 5 kHz, and several above 10 kHz.
Morel MDT-30-S
Frequency response and phase plots.
Notice the small dips at 4.4 kHz and 12 Khz.
Waterfall CSD
The peaks/dips seem fairly well damped. However, the z-axis is only 0 to -20 dB whereas on the other drivers the range is 0 to -25 dB. 🙁
Total Harmonic Distortion
Signal level is -19.5 dB.
Impedance
Signal level is -39.0 dB. Note the anomyly around 12-15 kHz. There is also an anomyly around 5 kHz, but it is much more subtle. This indicates a mechanical resonance in the system which can store energy. At higher test signal levels the anomylies are more pronounced.
