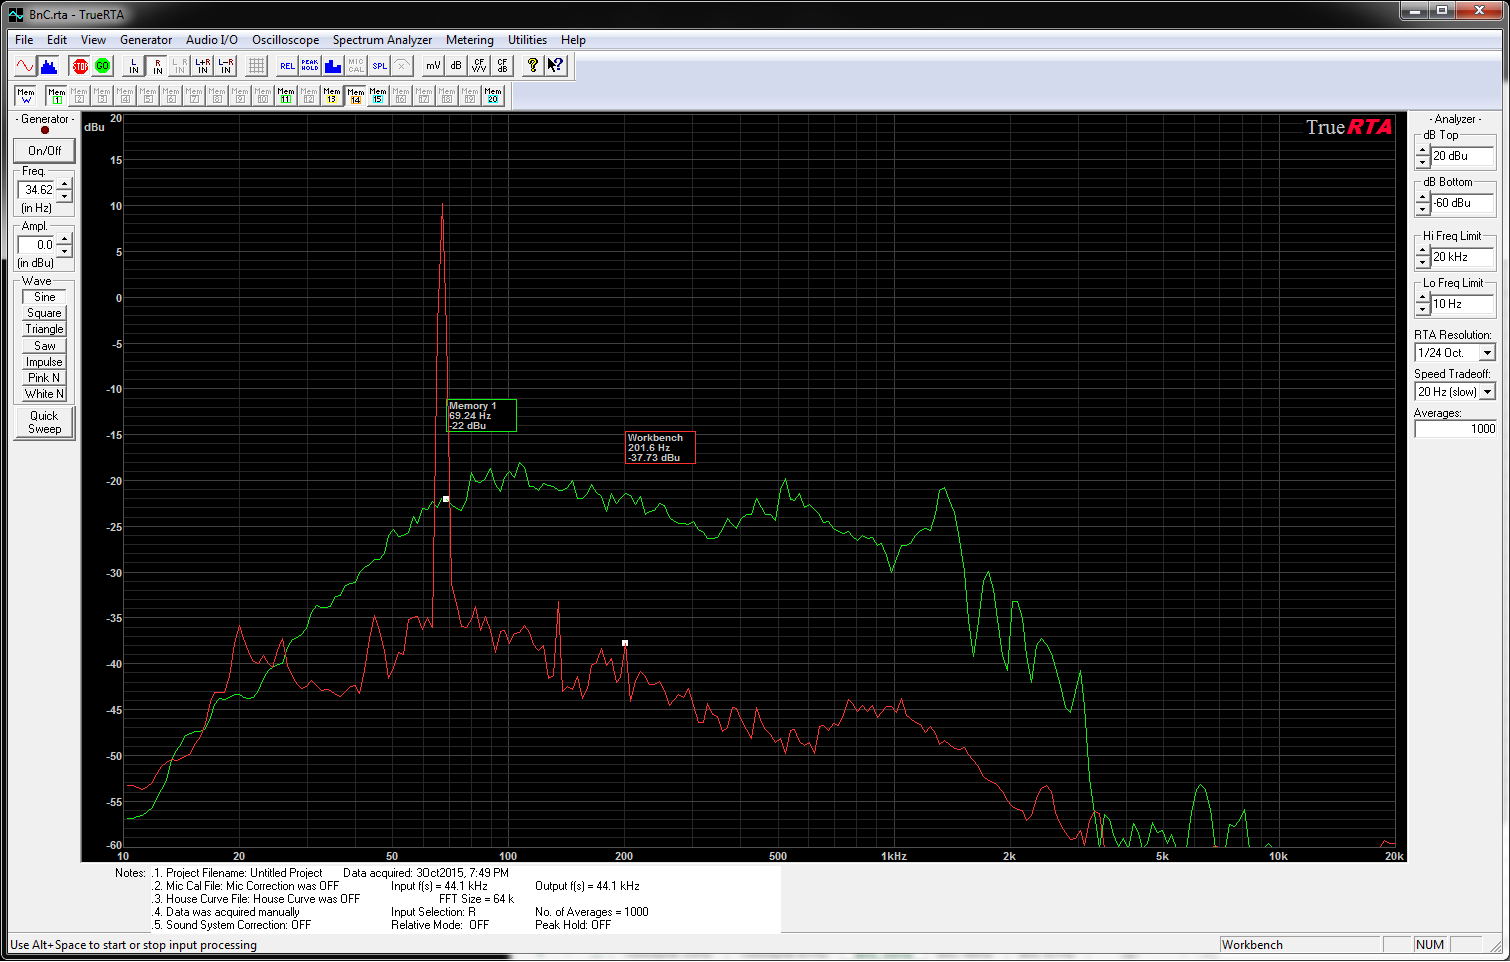
Next up is the B&C. Start with the frequency response, measured with the mic close, with pink noise, and averaging 1000 times. The Velodyne and PVR responses are shown for reference. Can you tell which is the PVR and which is the B&C? I double checked my notes, so not sure why these look the same, other than I must have over-wrote the PVR data 🙁
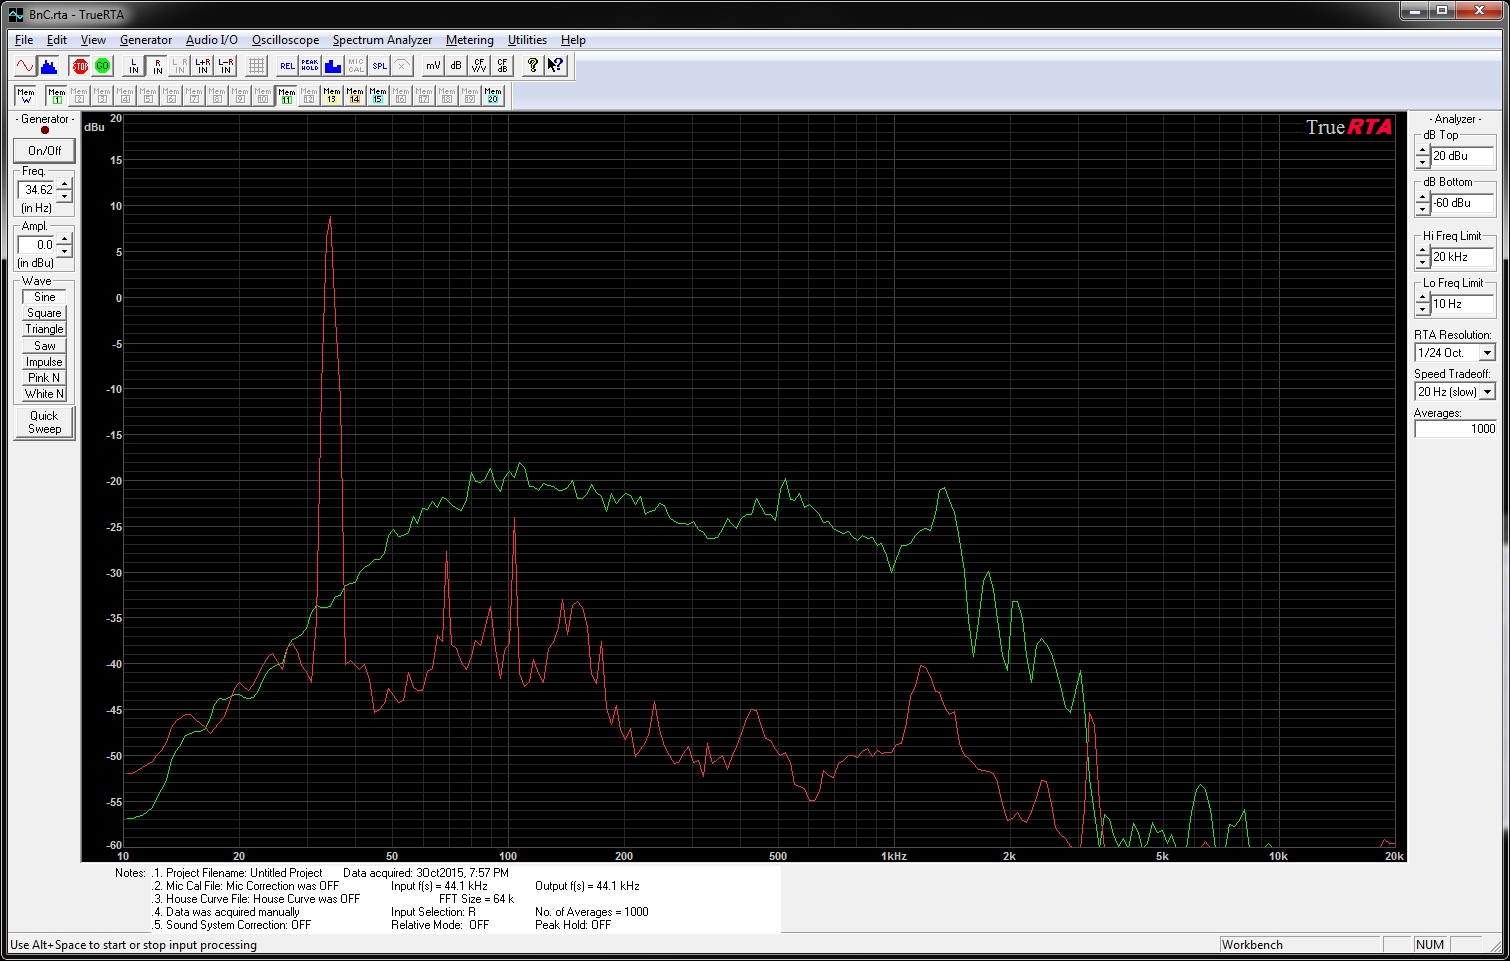
Now for the good stuff, the distortion measurements. These were difficult due to the high output and the driver.
- 35 Hz, 17″, 2.83 vRMS –> 2.7%
- 35 Hz, 39″, 5.9 vRMS –> 4.2%
- 35 Hz, 79″, 12.9 vRMS –> 8.1%
- 35 Hz, 79″, 22.5 vRMS –> 11.7% at an estimated 3.6 mm peak displacement
- 49 Hz, 39″, 2.83 vRMS –> 1.1%
- 49 Hz, 79″, 5.92 vRMS –> 1.5%
- 49 Hz, 79″ + reduced mic gain by -6 dB, 12.9 vRMS –> 2.93% at an estimated 1.9 mm peak displacement
- 67 Hz, 79″ –> 0.56%
- 67 Hz, 79″ + reduced mic gain by -6 dB, 5.95 vRMS –> 1.3% at an estimated 0.95 mm of displacement
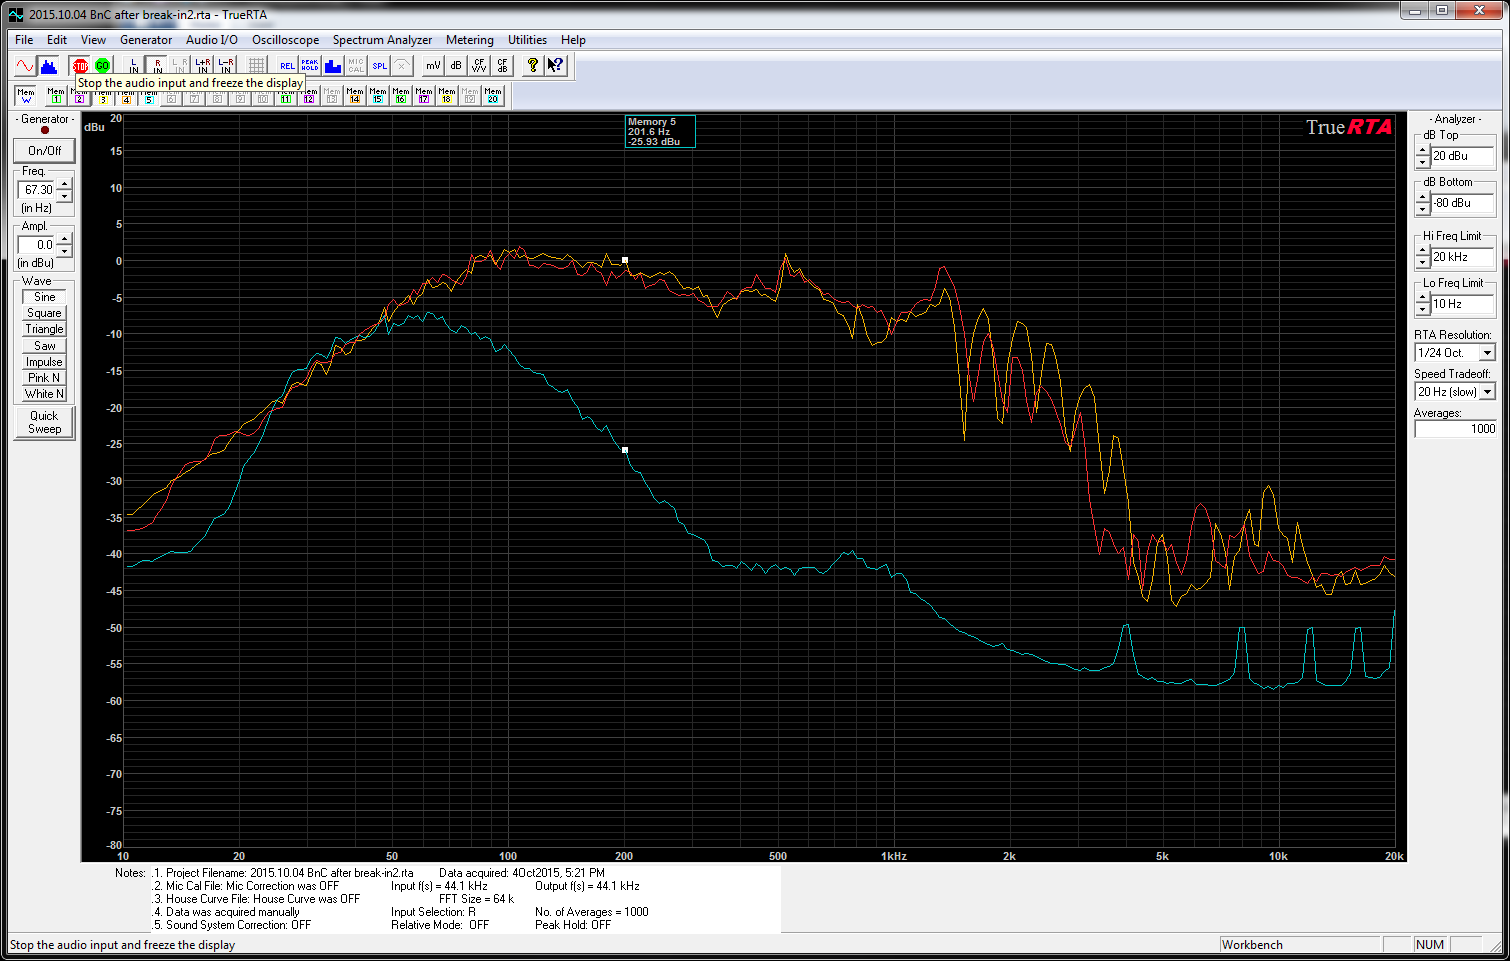
Why the additional measurement at 49 Hz? I have a theory as to why the distortion measurements are much higher at 35 Hz than 49 Hz. First, the displacement isn’t higher vs. the drive voltage for the two frequencies. This is because below the box tuned resonance of 67 Hz displacement flattens out. Not the same for output. Consider this picture of distortion vs. transfer function:
Notice the gain at 60 Hz is almost 12 dB (4x) higher than at 35 Hz. That is, when taking a measurement at 35 Hz, the second harmonic is getting amplified !!! The same thing does not happen at 67 Hz.