Speaker III – Prototype #4, The Return

It has been a long time since I have worked on a speaker project.  I have lots of parts sitting in boxes, just longing to become a full, functional speaker!  So this holiday season I decided to get back onto the horse and finish up Speaker III.  The first step is to figure out where I left off.

The first problem is the shielded tweeter.  I only bought two, and they are not available anymore.  This is not a bad problem – LCDs are the norm today and magnetic shielding isn’t as desirable as when I started Speaker III in 1998.  I found a substitution in the way of the Vifa D27TG-05-06.  It is a silk dome with ferrofluid like the D27SG-05-06.  Efficiency is similar between both units at 91/92 dB/2.83v, as is the resonance frequency of 1,000 Hz.

It is a lot of work to make your own cabinet with the number of small internal pieces.  So I decided to use a pre-fabricated MTM (mid-range / tweeter / mid-range) cabinet from Dayton Audio.  Internal volume is 0.75 cubic feet. The front baffle is removable and ready for your driver cut-outs.  Here is the Front Drawing with tweeter and mid-range locations and cut-outs.  Note how the lower mid-range is further away from the tweeter than in Prototype #3 (I will show why this is not good later in testing).

Well, I didn’t save myself that much work.  I wanted to do a round-over on the mid-range cut-outs based on my research into cleaning up the tweeter response.  I couldn’t find a router bit that would let me do that – not at a price < $100 anyways.  The solution was to make my own baffles out of two pieces of half-inch particle board and glue them together after making all the routes and holes.

Baffles drying after application of epoxy

Baffles drying after application of epoxy

Where did the work come in?  Trying to finish the baffles as nicely as the factory baffles.  To achieve a smooth finish I coated the baffles with an epoxy product.  Which I then sanded.  And then applied another coat.  And sanded.  And again.  And again.  Then I finally sprayed on a black laquer.

Baffle Black 1

Baffle Black 2

Speaker III – Crossover Design #1

The design of the first cross-over is done. The target is an acoustic 4th order Linkwitz-Riley at 2500 Hz. My simulated target responses using measurement data taken using a ground plane at 72″ is on the top (the data is not measured with crossover network, it is measured then a crossover simulated).  The bottom plot is based on a simulation of the drivers + crossover (which is why it is so smooth).

Screen shot 2014-01-18 at 11.17.16 PM

The electrical network is shown below.  Electrically the tweeter slope is 2nd order, and the mid-range unit crossover 3rd order transitioning to 2nd order (that is what the 1.5 ohm resistor does connected in series with the 18 uF cap).  Zobels are used on the mid-ranges.  Zobels are even on the mid-ranges before and after the 1/2-way cross-over inductor.  (Note shown: the capacitor value is 45 uF in series with 7 ohms for the Zobel to the left of the 1.8 mH inductor.)  The Vifa D27SG-05-06 has a faster high frequency roll-off than similar tweeters.  To compensate, the attenuation resistor is by-passed with a 15 uF capacitor.

img007

Speaker III – The Future

Plans

??? 2000

Try different back chambers for the Morel tweeter.

Summer 2000

First prototype cross-over design.
After I buy a house and can do some real mid-range measurements.

Present

March 2000

So far I have only done some computer simulation of crossovers.
I really want better measurements than I can perform in my
living room.
I’m thinking that will have to wait for owning a house, which I
hope to be doing sooner rather than later.

January 2000

The mid-range resonance at 1 kHz looks like a cone resonance,
coating the driver basket with bondo didn’t do a think
except make a mess of a couple of drivers.

August 1999

Mid-range testing.
I noticed what looks to be approximately a 1 kHz resonance during early
mid-range tests.
My guess is that this is from the driver basket resonating.
It may be possible to reduce the resonance by coating the basket with
a thick layer of bondo or other material.

July 1999

The mid-range positioning tests were quite a surprise.
I did not anticipate any of the results.
Using the results, I have built a third prototype cabinet.
The basic driver measurements look good, so its time
for port tuning and crossover design.

Past

February 1999

The diffraction tests were basically null results.
I did learn that the mid-range position on the baffle may affect
the tweeter’s response.
The next series of tests will be to determine a good mid-range position
relative to the tweeter.

January 1999

Tried different cabinet types and front baffle dimensions.

July 1998

First prototype cabinet completed.


Copyright © 1998,1999 John Lipp

Speaker III – The Crossover (Part 1)

It is finally time for the fun part of speaker design. In the introduction I set a goal for myself of trying to acheive a constant group delay. Some of you have to be wondering what I’m talking about. Group delay is the engineering term used to describe the average time delay over a range (i.e., “group”) of frequencies. In this case the interesting group of frequencies is the mid-range centered around 1 kHz. An ideal speaker should have a constant time delay at all frequencies (the time it takes for the sound to travel from the speaker to the listener, to be exact). Thus, the goal.

One way to acheive a constant group delay is with an acoustic first order crossover between mid-range and tweeter. The word acoustic should be emphasized: not all first order electrical networks result in a first order acoustic response. The driver’s own natural response always interfers to some degree. Unfortunately, first order filters have limitations. Their gentle slope does not provide good power protection for tweeters.  A low crossover frequency needed for a two-way design like Speaker III is obtainable only with tweeters specially designed to survive long and frequent mechanical excursions. Standard tweeters, such as the Vifa D27SG-05 I’m using, sound “nasally” near the crossover point when used this way. (Three-way designs aren’t so problematic.)  In addition, a substantial amount of driver frequency response overlap is required to obtain a flat frequency response. It is not uncommon for 2-way first order designs to end up with a frequency response hole or dip just below the crossover frequency.


xover_1st

The plot above represents the result of hours upon hours of time spent trying to obtain a first order acoustic response for Speaker III. The dip in response is not deep, only 3-6 dB, but it is quite wide, over an octave. Moreover, this octave is in the 1 kHz to 2 kHz region, the ear’s most sensitive.

I used actual on-axis measurements from prototype cabinet #3 to make the graph. The results would look much worse with off-axis data! Which is another problem with a first order crossover filter. The special crossover behavior for which so many compromises are made disappears quickly off the design’s listening axis.

That is not all. The overall response above the crossover point is not entirely that of the tweeter. About 1 dB of the level is from the mid-range’s response in this region, even though the mid-range is -10 dB down or more. A response region full of chaotic, irregular resonances. Clearly, a supremely non-resonant drivers are desired for a first order crossover design.

Never-the-less, the use of first order filters has its many proponents: ThielDynaudio, and Audio Concepts, just to name a few.  (It is worth noting that not all of these designers are going after a first order acoustic response. A 2nd/1st order hybrid crossover with flat frequency response does exist.) The primary arguement for the first order filter’s superiority
is greater time domain fidelity.


h_square

The plot above illustates this point. The yellow line is a digitally simulated total response from a 3 Khz, second order, Linkwitz-Riley filter network to a 1050 Hz square wave. By total response I means the acoustic sum of the tweeter and mid-range units at the listener’s position. The blue line is the 1050 Hz square wave and is also the output of a first order filter network. (For those interested in the exact filter I used, it is y[n] = a*y[n-1] – a*x[n] + x[n-1], where a = 0.6283.)

The big question: can the difference in these response actually be heard? The plot above is quite ominous looking, hinting that the answer must be yes. I had to know, so I performed the following experiment:

  • Extracted the audio from a few of my favorite compact discs using the
    ability of most PC CD-ROM drives to read the digital audio data directly.
    (The process is formally referred to as digital audio extracton.)
  • Wrote a computer program using MATLAB to load the data and simulate the crossover’s acoustic filtering.  The filter simulation was for a 3 kHz, second order, Linkwitz-Riley crossover network’s on axis response.
  • Filtered the data and wrote out the result in a 0.1 Hz multiplexed manner.  That is, the first 10 seconds of the output where the unfiltered data, the next 10 seconds where the simulated filter output, then the next 10 seconds were the unfiltered data, etc.
  • Burned the various songs I selected onto a CD-R.
  • Played my new CD-R on my Martin Logan CLS IIz system.  The CLS IIz are crossoverless…

What did I conclude after several listening sessions? I couldn’t tell when the simulated crossover filter was “switched in” or “switched out”. Not even watching the time counter on my transport.

My conclusion from the experiment is obvious. I don’t see paying all the first order crossover penalties for a “benefit” that I can’t hear. Is my experiment conclusive? No, the simulated crossover frequency was 3 kHz, and I only tested 8 songs. Plus, the reason for the improvements of a first order crossover may have nothing to do with time domain response. The simple is better phylosophy may apply, meaning that fewer filter elements translates into less coloration.


Here is the simulated Speaker III on-axis response to a second order crossover design
that I worked out:

xover_2nd

The improvement in frequency response over the first order filter is tremendous. Also note that the high-frequency response is not contaminated nearly as much by the mid-range.


Copyright © 2000 John Lipp

Speaker III – Prototype Cabinet #3

Testing Environment

Prototype3 MeasureProto3

Tweeter and (Combined) Mid-range Responses

Prototype3_all

Blue Prints of the Cabinet

First, I calculated the internal dimensions of the cabinet to see how big the shape I picked would be if it held 18 liters. Notice the two triangular sections… these are where the crossover will go. With separate chambers, the tweeter and woofer crossover components can be physically separated to help prevent electrical interaction.

The dimensions looked Ok. So I placed the drivers on the proposed cabinet front to see how they would fit. Just barely! Notice that the tweeter is placed closer to the upper mid-range. Also, the mid-ranges are going to be recessed by 1/4″, thus a line is drawn to provide the extra space required away from the tweeter.  The reflex port has to be on the cabinet’s back behind the tweeter.

blueprint1of4 blueprint2of4

spkr3_prot3_front

skpr3_back_xover

Next I looked at where the internal bracing would be positioned relative to the drivers.
The front baffle is double thickness, with additional double thickness behind just the tweeter in order to form a sealed, rear chamber for it. The side-cut is meant to show those pieces bracing the sides. These side-braces are each then braced vertically (not shown).

blueprint3of4 blueprint4of4


Copyright © 1999 John Lipp

Speaker III – The Tweeters (Part 3)

As mentioned in The Tweeters, Part 2, the presence of mid-ranges on the baffle appeared to be the most significant contributor to tweeter response anomalies.  So I built several test baffles for the Vifa D27SG-05 to test my ideas on how to eliminate or minimized the mid-ranges’ detrimental effects.

Testing Methodology, Mark III

I tested 5 different baffle/driver configurations. Four of these were mid-range + tweeter + mid-range (MTM) configurations. The odd-ball configuration required only a tweeter because the “tweeter only” results were poor enough not to bother with adding the mid-ranges.  As part of the testing I retested the plain baffle with just the Vifa D27SG-05 tweeter
flush mounted. I used the same 2’x4’x3/4″ MDF boards from The Tweeters, Part 2 and followed similar manufacturing procedures:

  • The tweeter locations were 9-1/8″ from the left baffle edge and 18-1/4″ from the top baffle edge. That is, the ratios between the top/bottom and left/right edge distances are the golden mean, 1.616 to 1. I chooose the golden mean since previous tweeter testing with that ratio went well.
  • Each tweeter was recessed so the faceplate was flush with the baffle, except for the odd-ball case. It’s tweeter was recessed 1/8″ by a 1/2″ diameter conical ring around the tweeter face plate. The recess was formed using auto repair bondo.
    TweeterTestingIIIe
  • The top mid-range was centered left/right on the baffle, the lower was aligned so that the left/right ratio was the golden mean.
  • The upper mid-range was positioned as close to the tweeter as possible.  In the first MTM experiment, the lower mid-range was also positioned as close to the tweeter as possible. In all the other MTM experiments the lower mid-range was positioned so that the ratio of the lower/upper mid-range surround-to-tweeter distances was the golden mean.
  • Three variations of the MTM experiment with mid-range golden mean distance ratios were evaluated: mid-ranges flush-mounted, mid-ranges flush-mounted with caulk obscurations, and mid-ranges inset into rounded-over recesses.
  • The left/right baffle edges (but not the top/bottom edges) were rounded over with a 3/4″ radius.
  • Mortite™ caulk formed the seal between tweeters, mid-ranges and baffles.
  • The microphone was at a distance of 18″ from the baffle and at the same height as each tweeter. The resulting 3.5ms anechoaic test window yields a lower test frequency of around 300 Hz.


The Baffles Caulked Baffle
TweeterTestingIIIa TweeterTestingIIIb

The photo on the left illustrates 2 of the test baffles (from left to right):

  • Prototype #2 (already tested).
  • Baffle with flush mounted mid-ranges equally distant from the tweeter.
  • Baffle with flush mounted mid-ranges spaced from the tweeter using a golden mean ratio.
  • Reference test baffle (already tested, results will be retested).
  • Morel reference test baffle (not used).

The photo on the right is a close-up of the un-equally spaced mid-range baffle. Caulk has been molded to “block the view” of the tweeter so that it cannot “see” the mid-range surrounds. The concept is that sound radiating from the tweeter is bouncing off of the mid-range surround towards the microphone (listener).


Inset Mid-ranges Close-up
TweeterTestingIIIc TweeterTestingIIId

The fourth test baffle is illustrated above with a full and close-up shot. The mid-ranges are spaced unequally distant from the tweeter using a golden mean ratio. Instead of flush mounting, the mid-ranges are inset a little more than 1/4″. The mid-range recess is rounded over with a 1/4″ radius bit. The purpose is to inhibit the tweeter from “seeing” the mid-range surrounds by blocking the view.

Sorry, no pictures of the odd-ball, tweeter-only experiment. I’m resurecting it from the great saw-dust bin in the sky.

Test Results

Equally/Unequally Distant Mid-ranges vs. Bare Baffle

Golden_bare
The presense of the mid-ranges is definetly detrimental to the tweeter’s response. The distance of the mid-ranges from the tweeter is a factor, but not as significant as the mid-range’s presence. The results are also similar to Prototype Cabinet #2.

Recessed Tweeter vs. Bare Baffle

Bondo2_bare
I never got further than mounting the tweeter in the recessed bondo-formed hole in the MDF board. Recessing the tweeter is not much better than mid-ranges with a flush mounted tweeter.

Caulk Barrier vs. Bare Baffle

Caulk_bare
The effectiveness of just blocking the acoustic path between the mid-ranges and tweeter surprised me. I believe an important factor in this success is the angle made by the caulk with respect to the baffle surphace. It is very shallow.  As a result the sound waves from the tweeter bounce towards the floor and ceiling instead of towards the microphone (listener).

The success of this baffle strategy has given me other ideas. There are so many shapes and variations on this reflector theme to try. For example, the tweeter rings that are advertised. Extend that idea and cover the whole baffle in 1/4″ thick felt or similar material. Covering the caulk with felt is also possible.

Inset Mid-ranges vs. Bare Baffle

Recessed_bare
This is the ticket. Much more impressive than I was expecting after the failure with trying to recess the tweeter.

Conclusions

The small size of Speaker III precludes a large reflector like that I made using the Mortite™ caulk. Since the inset mid-range results were so good, I have elected that strategy for Prototype Cabinet #3.  I may also experiment with some shallow obscurations in conjunction with insetting the mid-ranges.


Copyright © 1999 John Lipp

Speaker III – The Tweeters (Part 2)

morelAs mentioned in earlier tweeter testing , I wanted to revisit some of my tests of the Vifa D27SG-05 and the Morel MDT-30-S. I was suspicious of the foam board introducing measurement anomylies that were not part of the tweeters’ natural responses.

Testing Methodology, Mark II

TweeterTestingII

Testing environment is as before, in the corner of my apartment’s living room. I found some 2’x4’x3/4″ MDF boards at my local Home Depot store.  Since they would fit through the trunk of my BMW M3 (unlike a 4’x 8′ sheet), I bought a pair to make two, dedicated test baffles.  The details:

  • The tweeter locations were 9-1/8″ from the left baffle edge and 18-1/4″ from the top
    baffle edge. That is, the ratios between the top/bottom and left/right edge
    distances as the golden mean, 1.616 to 1.
    I chooose the golden mean since previous tweeter testing with that ratio went well.
  • Each tweeter was recessed so the faceplate was flush with the baffle.
  • The left/right baffle edges (but not the top/bottom edges) were rounded over
    with a 1/2″ radius.
  • Mortite&trade caulk formed the seal between tweeters and baffles.
  • The microphone was at a distance of 18″ from the baffle and at the same height as
    each tweeter. The resulting 3.5ms anechoaic test window yields a lower test
    frequency of 300 Hz.

Caution!

I should mention that MDF has very sharp edges.  Combine this with a large sheet’s weight and a disaster is a possibility.  When handling large sheets, I heartily recommend wearing leather gloves.  For smaller pieces, I would not hold them such that if you loose control, the edge of the board will slide across your hand.  Especially if working the piece with some type of power tool. Ouch!

Test Results

I didn’t have to do too much testing before I was convinced the Vifa tweeter was the better choice for Speaker III.  The first plot is a comparison of the frequency responses of the Vifa (top, flat curve) and Morel (bottom, ugly curve).

compare

The Morel shows two response dips, a narrow dip at about 12 kHz and a wide dip between 3-5 kHz.  The dip at 12 kHz has a corresponding peak at 15 kHz.  This is similar to the foam board test results.

The only anomyly in the Vifa response is a little bit of ripple, most likely from baffle diffraction since the same trends show up in the response of the Morel tweeter as well.  The dips at 7 kHz and 14 kHz in the Vifa foam board tests are now absent.  (Sorry, no comparison plots.)  This suggests the foam board affected the first Vifa tweeter measurements; both samples show no response anomylies on the larger, solid MDF test baffle.  The Morel is a different story; the response dips are similar in the new and the old tests.  I’m a little stumped, and I don’t have a plan yet to become unstumped.

The astute surfer probably has noticed that the Morel response curve is about 2-3 dB lower than the Vifa response curve.  Nothing special is going on; the Vifa is simply a little more efficient than the Morel and has a lower DC resistance (which translates into more power for the same amount of input voltage).

Vifa Magnitude and Phase

vifa
These are impressive plots, as were the corresponding time-domain and waterfall plots.  They should be compared and constrasted with the tests done for prototype cabinet #2 .
Although only just a slightly smaller baffle, prototype cabinet #2 has two mid-ranges mounted in it that definitely affect the frequency response!

There is a downside to the Vifa, however.  The response falls off in the upper octave by 3 dB at 20 kHz.  Fortunately, this can be corrected in a crossover L-pad circuit.

Comparisons with Prototype Cabinet #2

Tweeter test baffle #2 is close in size to the front baffle of prototype cabinet #2.  Yet, the tweeter measurements of prototype #2 show peaks and dips not present in these tests:
Bare_vs_Proto2

The major difference between these measurements are

  1. Prototype #2 is made from particle board, these test baffles are MDF.
  2. Prototype #2 has two mid-ranges present. Moreover, the mid-ranges are
    equidistant from the tweeter.

I really doubt the first difference is significant.  Thus, I submit that the presence of mid-ranges on the front baffle affects the response more than diffraction in these tests. It makes sense; the mid-ranges are quite a bit closer to the tweeter than the baffle edge.  In fact, I spaced the mid-ranges equidistant from the tweeter.  And I already showed placing the tweeter in the center of a baffle equidistant from the baffle edges was a poor choice.
Ooops!  Cleary some mid-range baffle position experiments are in order for the future.

Morel Magnitude and Phase

morel
Notice the phase shows purtibations corresponding to the peaks and dips in the magnitude of the response.  Not much else need be said.

The Future: Morel Tweaking

I haven’t completely given up on the Morel yet. I started surgery on one of the units.
Testing with the back-chamber (made of plastic, not metal, like the Vifa) removed has demonstrated the shape of and damping material in this chamber noticably affect the response.


Copyright © 1998,1999 John Lipp

Speaker III – Prototype Cabinet #2

Prototype #1 is a rather “typical” enclosure. The front baffle is just wide enough, and tall enough for the drivers and a (future) bass-reflex port. The remainder of the volume is depth.  Anyone can, and it seems everyone does, make a cabinet that simple. But what about a cabinet that is just the opposite? Tall, wide, and just deep enough to form a golden-mean transmission line.

Prototype #2 Description

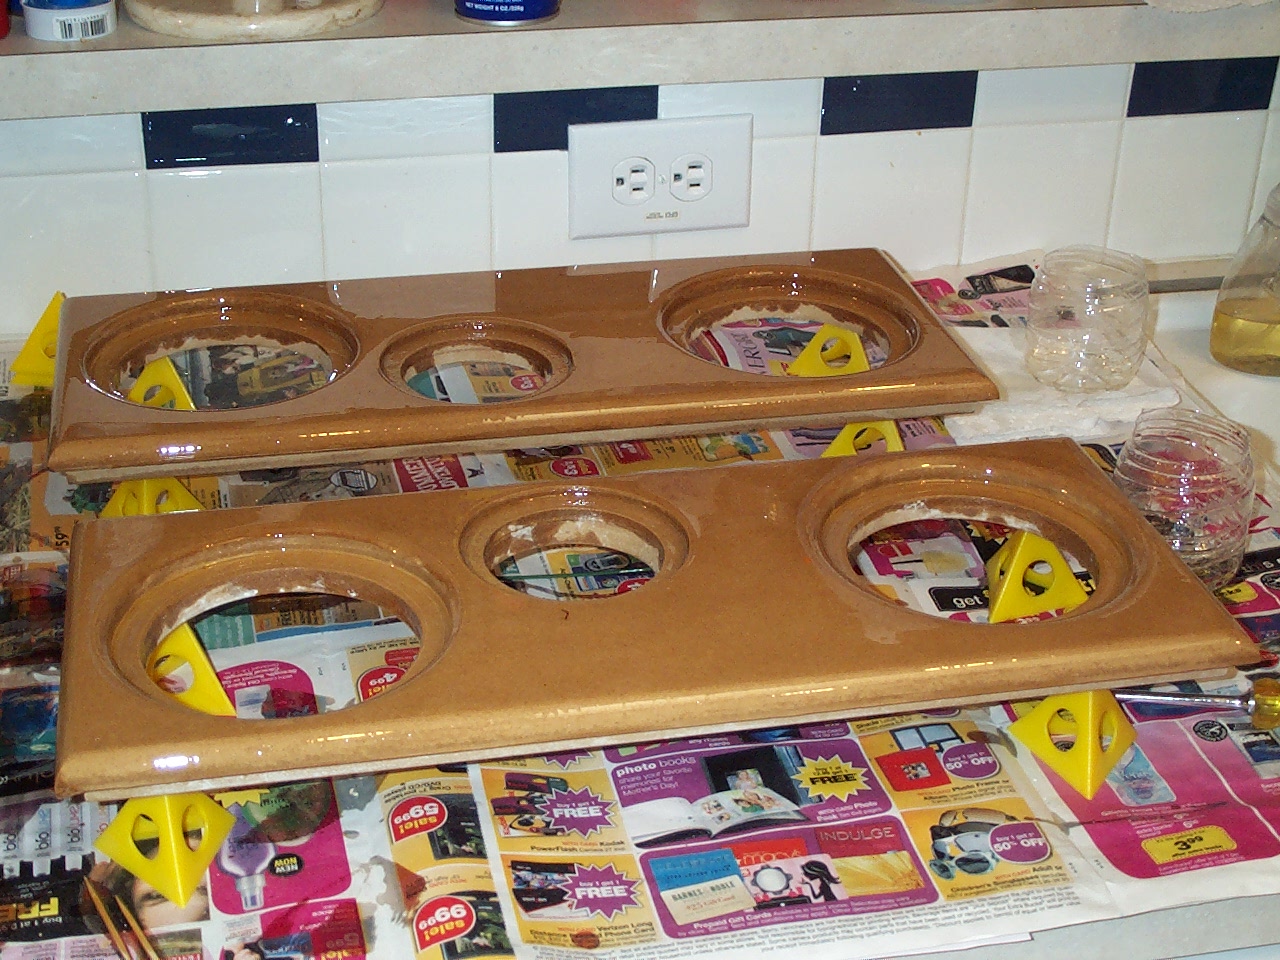
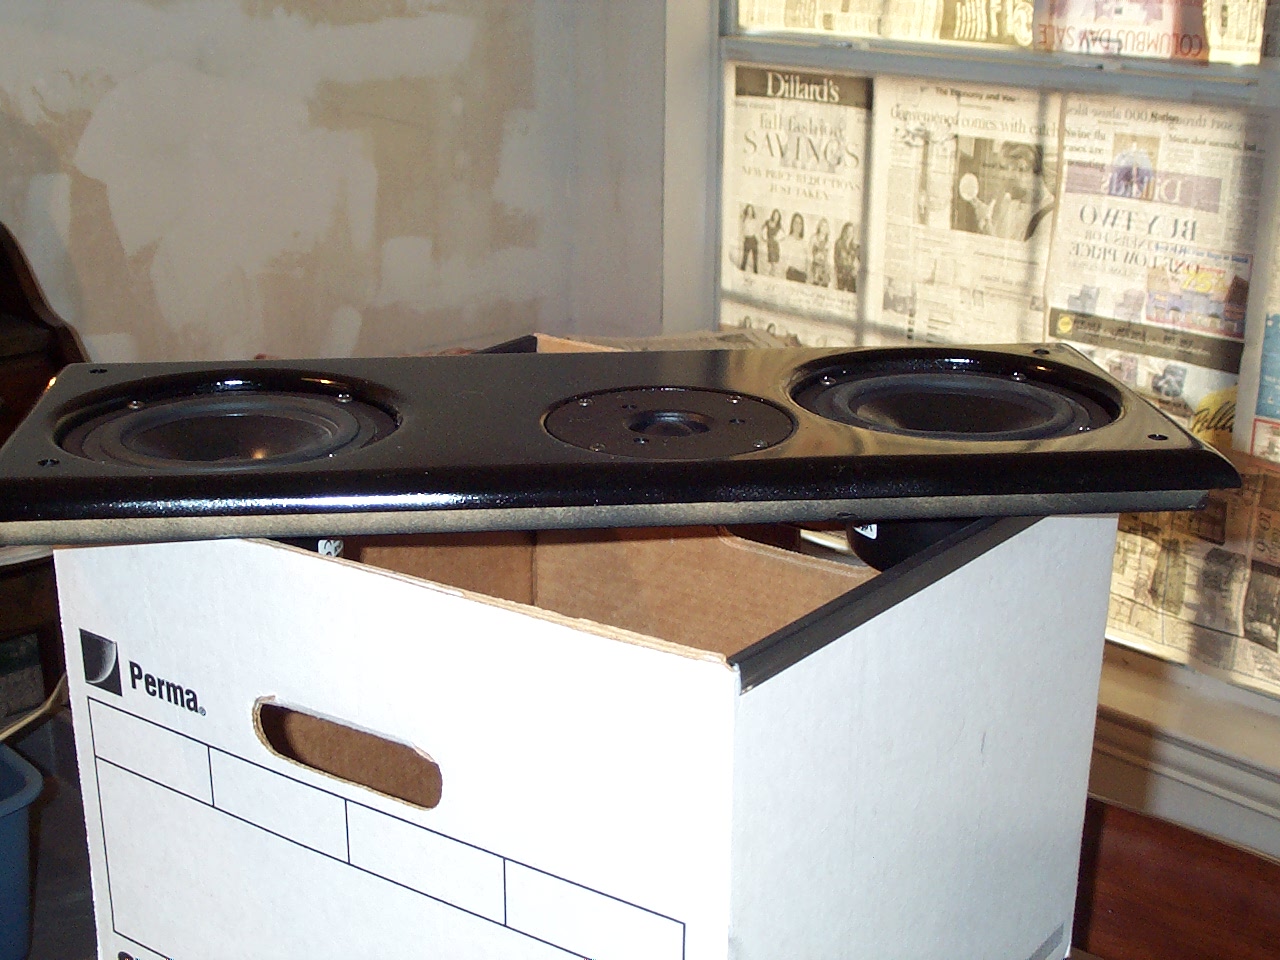
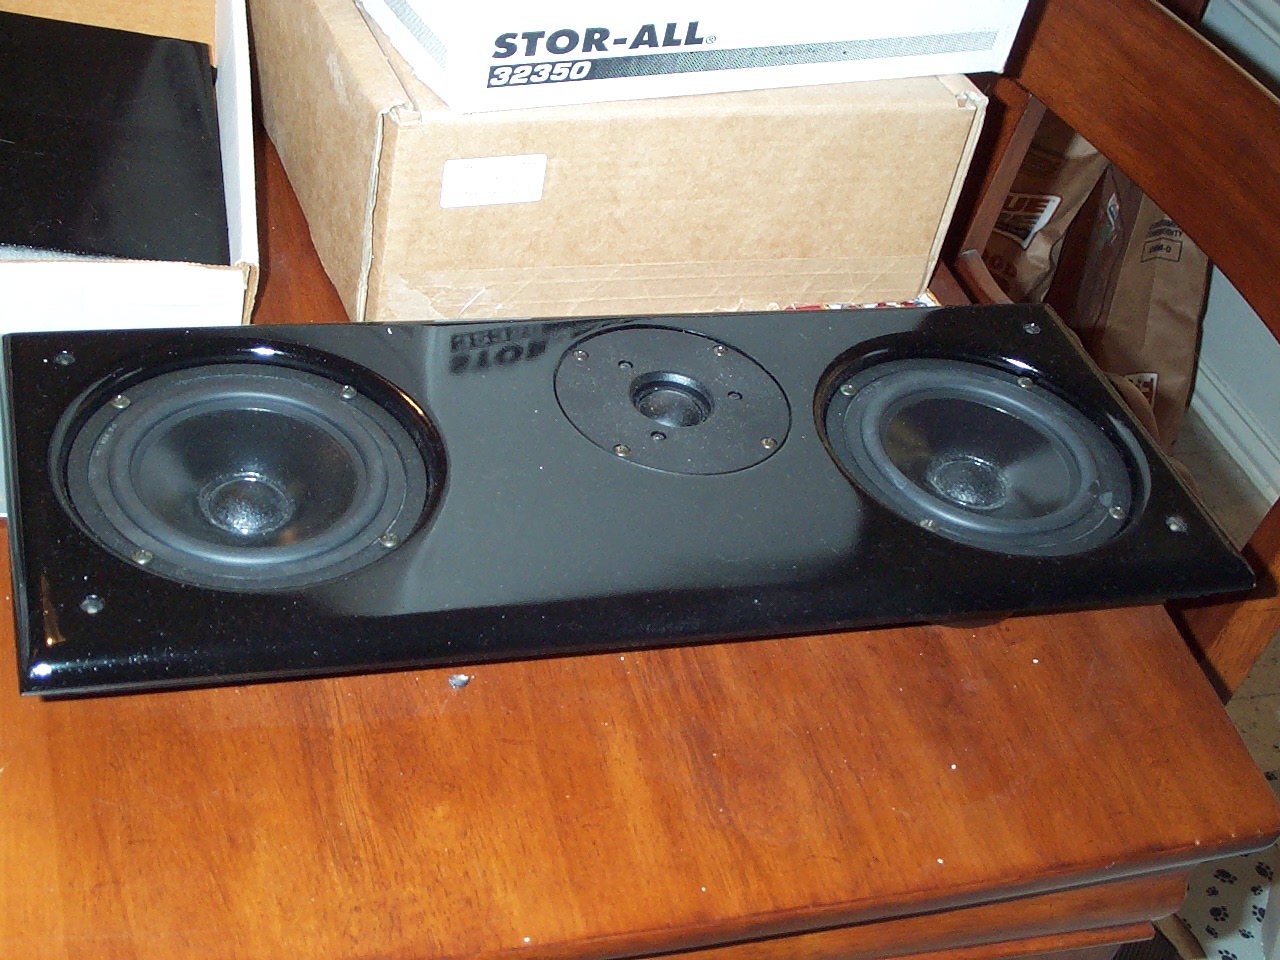
The cross-sectional dimensions of the golden-mean transmission line are 2-3/4″ deep by 4-1/2″ wide. This width fits perfectly with the Vifa mid-range’s mounting hole diameter. Add a 1-1/2″ double-thickness front and a single-thickness 3/4″ back to the depth generates a total cabinet depth of 5″. But what dimensions for the cabinet front? Well, nothing is wrong with a 1:4:9 ratio, so why not 20″x45″! I had yet to discover medium sized pieces of MDF board at Home Depot (read: pieces of MDF that fit into the trunk of a 3 series BMW). So, to get a 20″ wide face, I glued together two 12″x48″ deep shelf boards. Another shelf board section was glued to the back to get a double baffle where the drivers mount. You can see the sanding marks where the glue edge was smoothed in the front. A few passes with the router set up a 1/4″ deep labyrinth for the walls that would define the rear chambers for each mid-range.  I wasn’t working towards testing a transmission line yet so I made these chambers 4 liters, stuffed with some spare wool, and sealed.


Front Inside Back
proto2_front proto2_inside proto2_back


Narrow & Tall vs. Wide & Deep Cabinet

Having two cabinets with opposite shapes begs the question: what will the differences in driver responses be? My expectation was to see much less ripple in the responses measured on the wide and tall baffle, especially in the upper mid-range. The differences I found, however, were not that significant.

General Testing Conditions

As usual, testing was done in a section of my living room that I have freed up of clutter and furniture. To get a clean measurement, the microphone distance was 18″. As shown in the front picture above, the measurement position is just in front of my washer/dryer closet. For some of the tests Speaker II is used as a stand to raise the driver level and thereby increase the measurement window length.

I also (finally) took the time to learn how to save response data in LAud™ and then display multiple measurement records on the same plot. Thus, most graphs are comparisons of some sort.
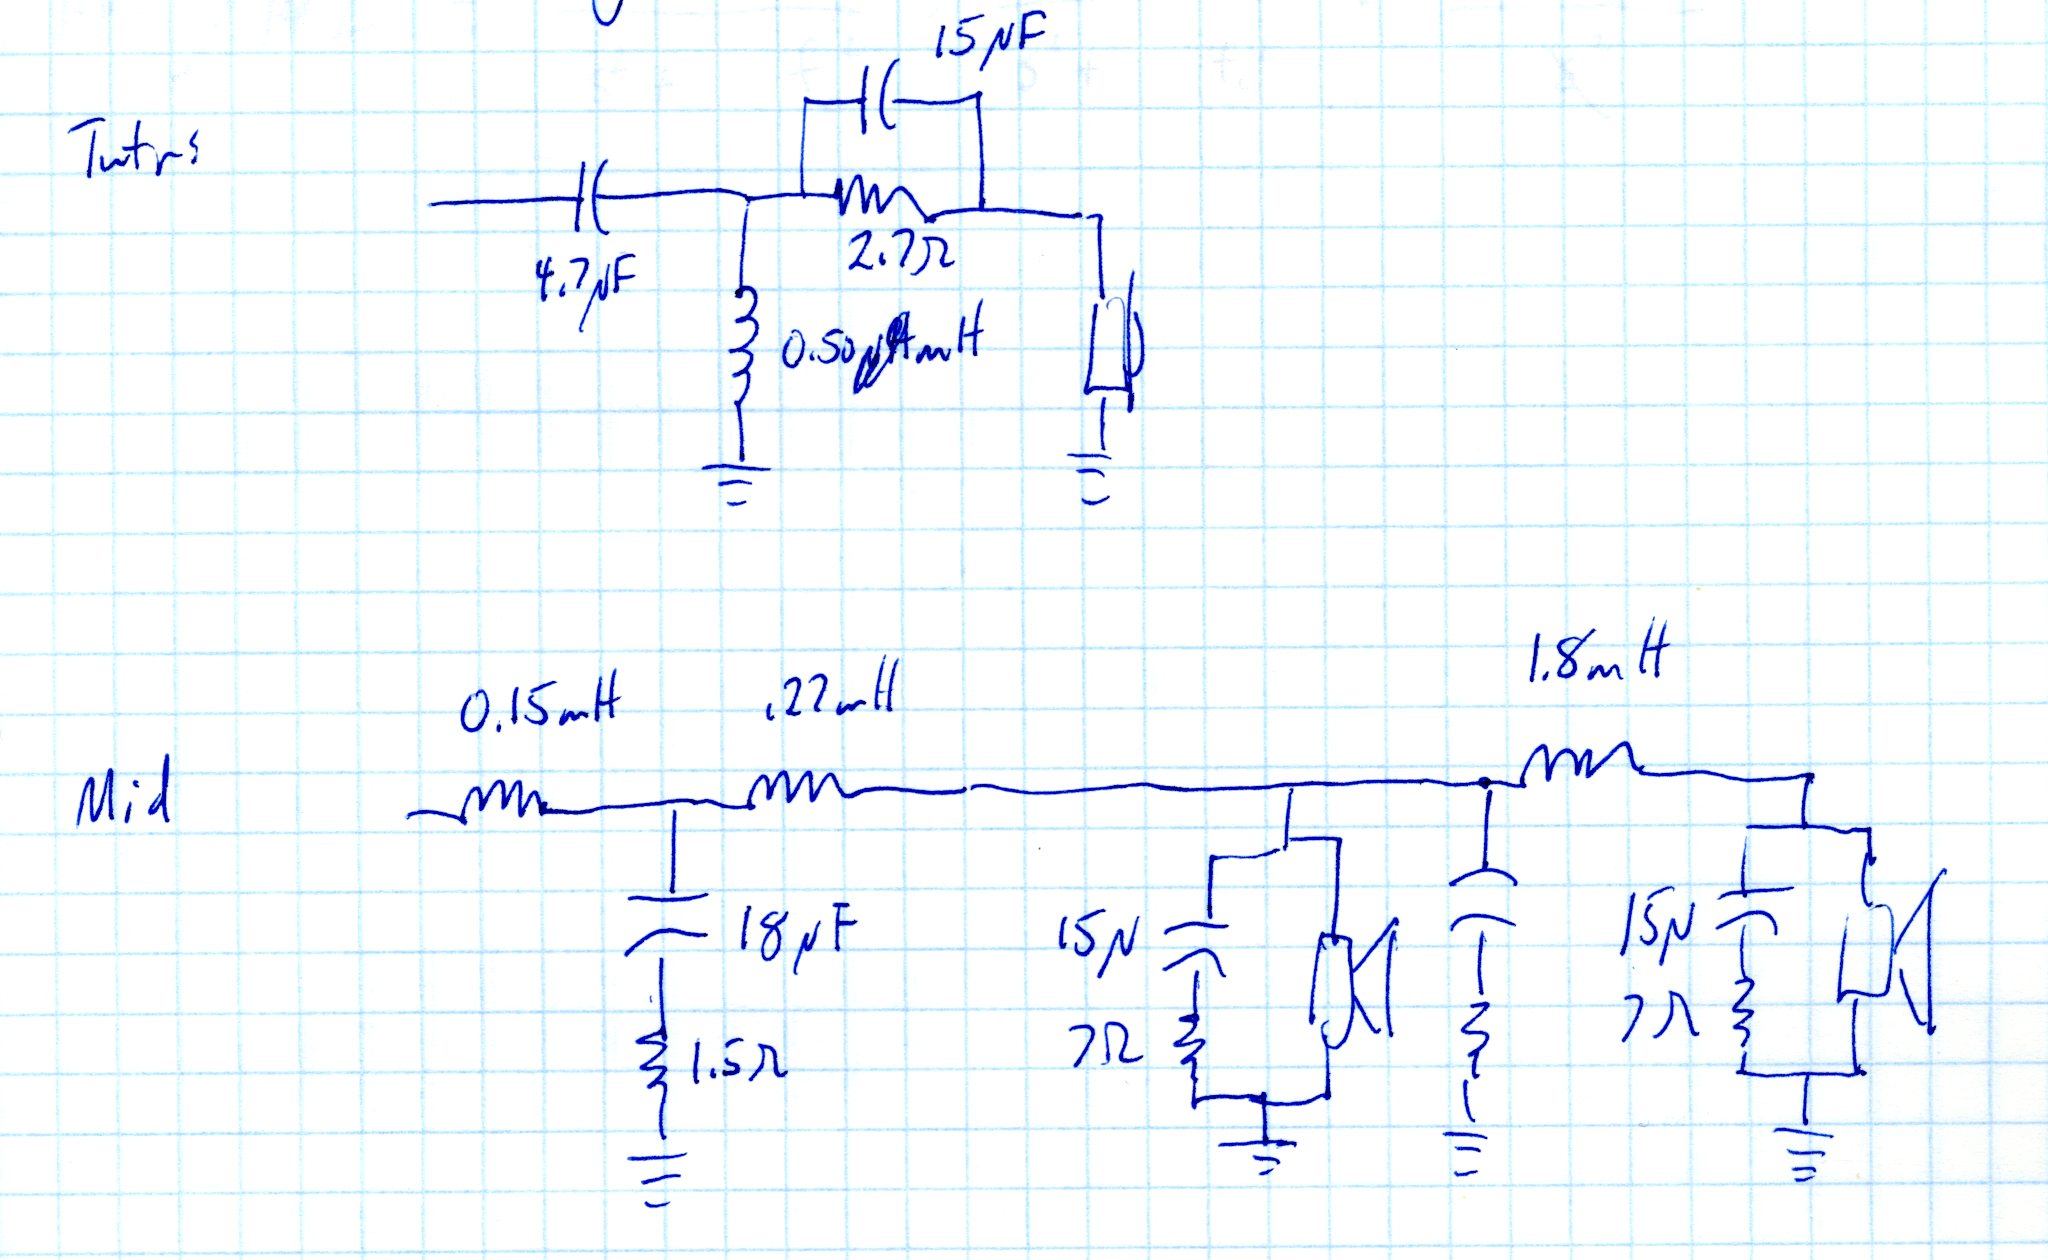
Tweeter Tests

The acoustic diffraction induced response anomylies I was expecting didn’t show up at all!
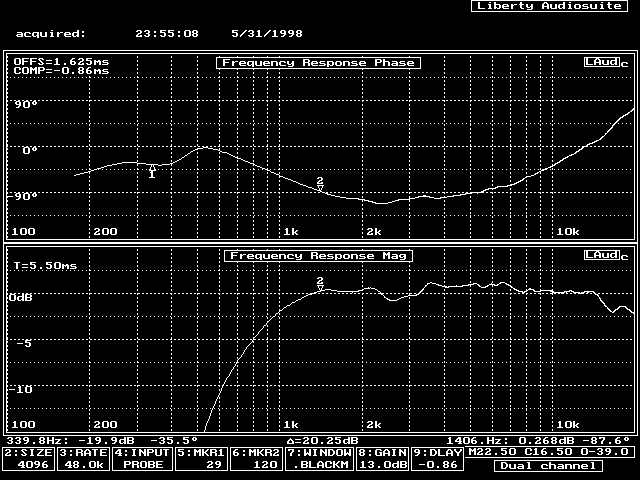
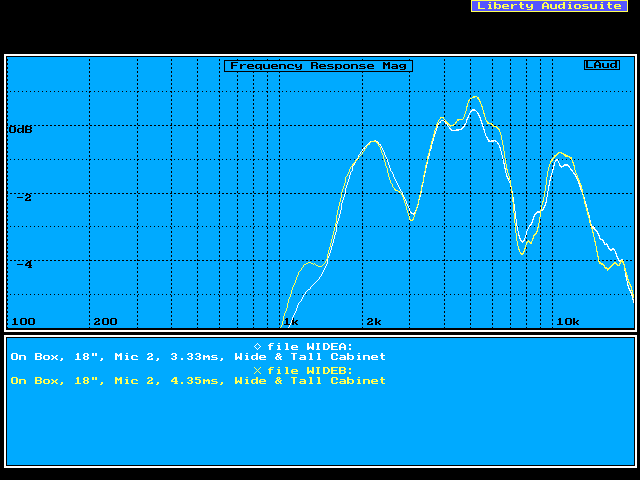
At this point I was rather perplexed. The first thought that came to mind was that the tweeters in each prototype cabinet are different. Thus, I swapped the tweeters between the narrow and wide cabinets. I had to be sure that what I was measuring was not a variation in tweeter units. Take a look at tweeter unit “A” measured in each prototype cabinet:

CompareTwtrA

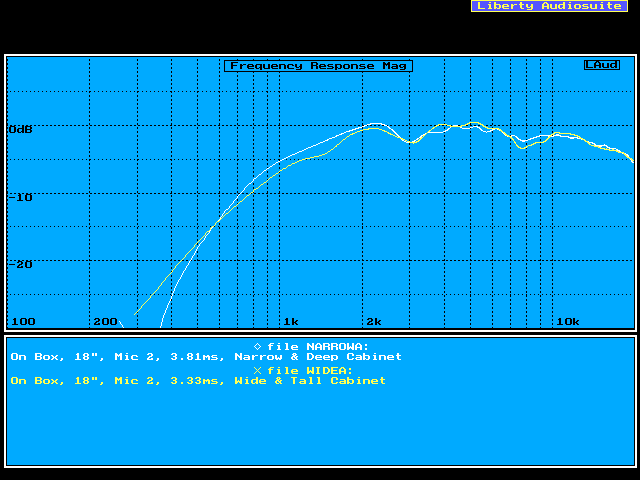
There is not a whole lot of difference! I was expecting much more of a delta between these two measurements. The diffraction theory I had been reading strongly suggested

  • The response dips and peaks would be at different frequencies, and
  • The magnitude of the dips and peaks would be at least 3 dB less on the wide cabinet.

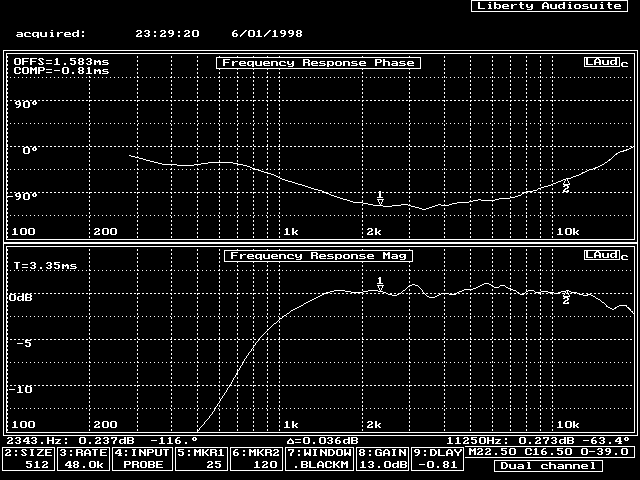
If anything, it appears that the wide & tall cabinet has more pronounced dips in the response. Compare this to tweeter unit “B”:

CompareTwtrB

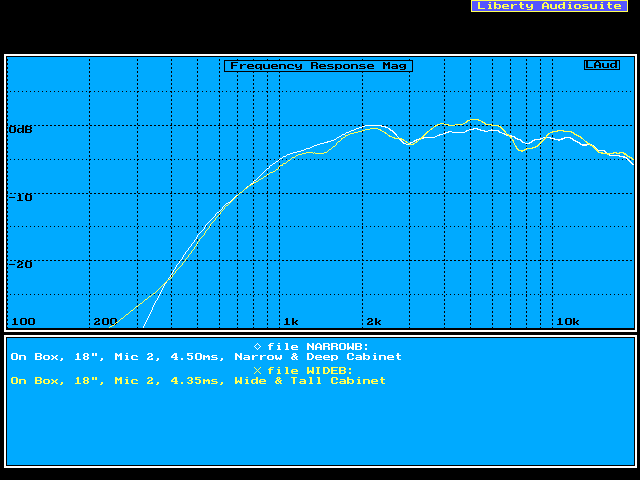
The trends are the same. Hmmmmm… next question… how well matched are the two Vifa tweeter samples? Tweeters A and B on the wide & tall baffle:

WideTwtrAB

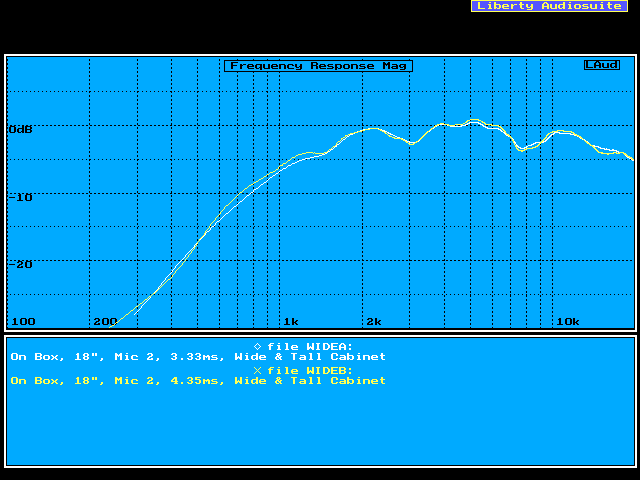
As you can see, the match is quite good. Keep in mind that these units are not a matched pair! (They are probably from the same lot.) Now expand the graph’s y-scaling to see just how closely the units match (both baffles shown):

NarrowTwtrAB2

WideTwtrAB2

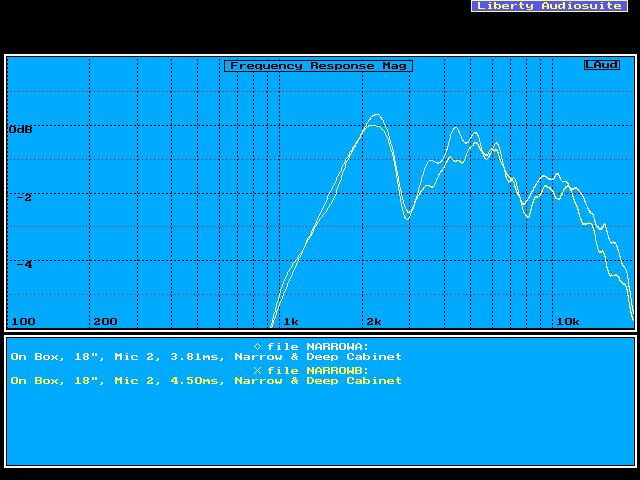
I would say the quality of matching is about +/- 0.5 dB. Both Morel and Dynaudio charge $$$ for this, but with Vifa you get it for free!

Mid-range Tests

Testing the mid-ranges proved more difficult than the tweeters.

  • I couldn’t test the top and bottom mid-ranges independently and do a comparison between the wide & tall and narrow & deep baffles. Why? The mid-ranges in prototype #1 share a common enclosure while those of prototype #2 each have separate enclosures. That is, if only one mid-range is connected in prototype #1, the other mid-range acts as a passive radiator. That changes the bass response, and possibly affects hi-frequency measurements too.
  • Guaging baffle diffraction correctly for these tests requires measurements below 100 Hz. The long time measurement this requires will include a strong floor reflection, a.k.a., floor-bounce. Floor-bounce commonly manafests itself as a dip in the mid-bass region somewhere between 200 – 400 Hz. This dip is sometimes also accompanied by a peak of 3 – 6 dB at about double the dip’s frequency.

The first issue required connecting the mid-ranges together and carefully positioning the microphone the same distance from each mid-range dust cap. Speaker II was used as a stand for prototype #1, then turned on its side as a stand to raise prototype #2’s driver heights. That I figured would minimize the floor reflection as much as possible. In addition, the mid-range plots were all smoothed in order to reduce “reflection noise.”

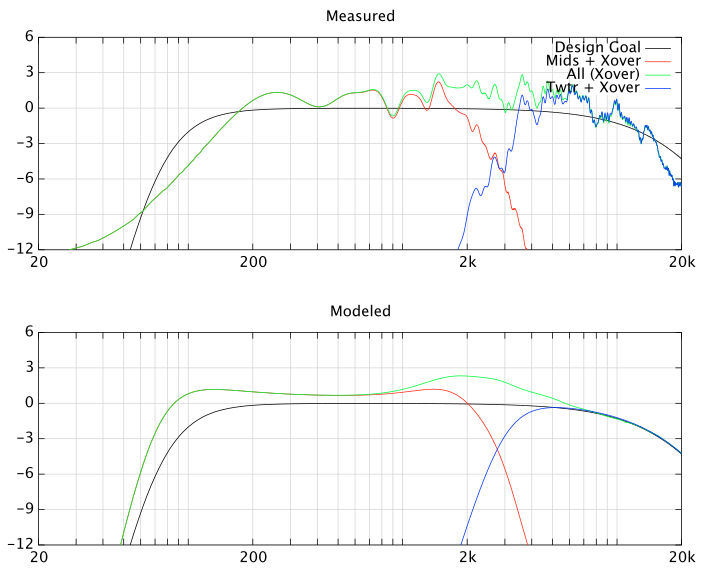
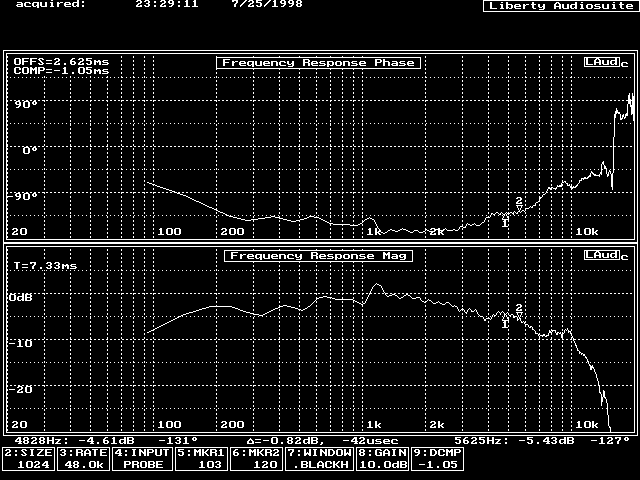
Here is the graph comparing the narrow & deep cabinet with the wide & tall cabinet. This plot has 1/12th octave smoothing:

CompareMids_12th

Most of the small dips and peaks are found in both measurements, especially in the high frequencies. The primary difference is in the lower mid-bass. There, the large baffle has substantially more response. The next plot is smoothed with a 1/3rd octave filter to help to illuminate the general trends in the response curve:

CompareMids

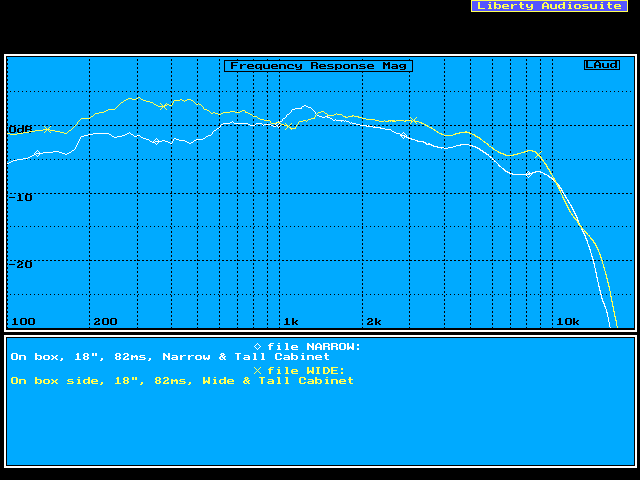
The general impression is that the mid-range drivers in the wide & tall baffle are more efficient. This is as it should be; the mid-bass region should be lifted up because the diffraction frequency is lowered from about 700 Hz to 150 Hz. It also does appear that this Vifa mid-range’s response has been designed to be flat on a “typical,” narrow baffle.

30 degree Off-axis Mid-range Tests

Having established that the mid-bass is lifted by a wider baffle, the next step was examining effects of a wider baffle on off-axis response.

CompareMids30

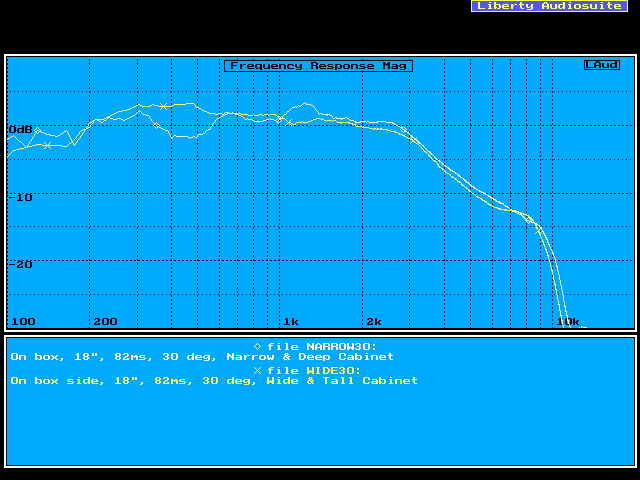
It appears that the hi-frequency response roll-offs are the same for the wide & tall and narrow & deep enclosures. Question answered. The final two graphs compare the on- and off-axis response of the prototype cabinets to themselves.

NarrowMids30
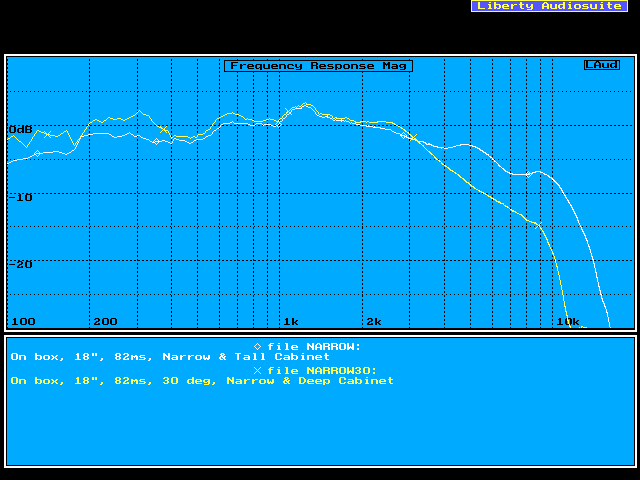
The measurements don’t compare too well, but the on- and off-axis responses separate starting at 3 kHz for the narrow enclosure.

NarrowMids30

The wide enclosure measurements are better behaved. The separation of the on- and off-axis responses is again 3 kHz. However, the 2-3 kHz range has a little more seperation, but I doubt it is significant.
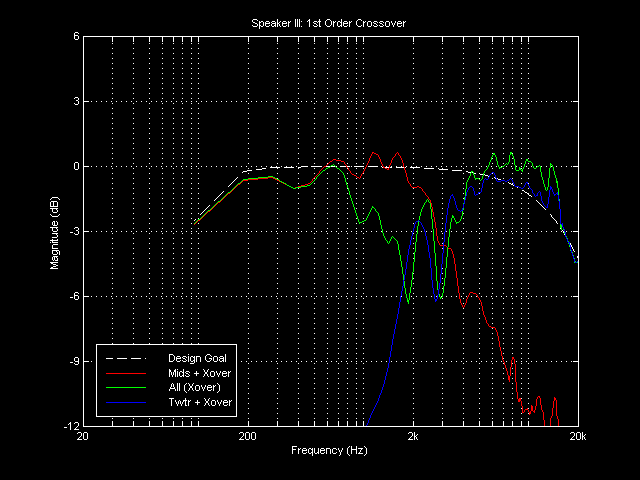
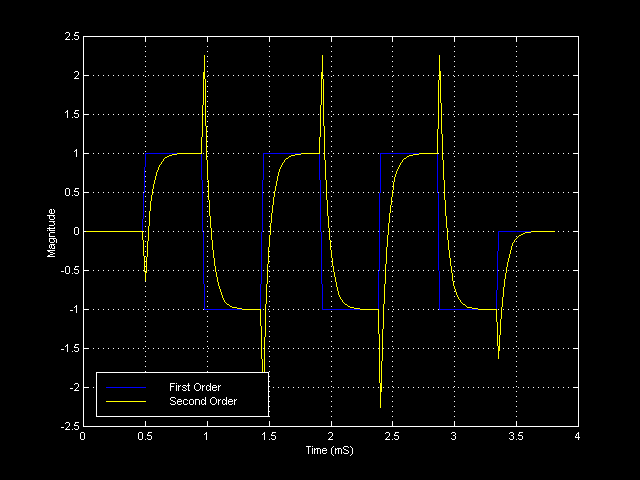
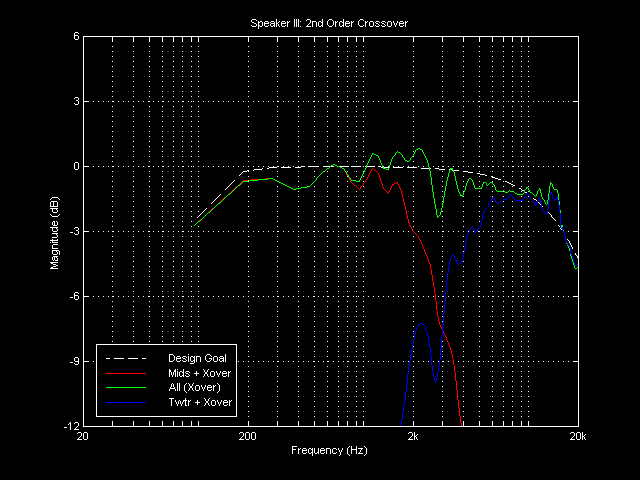
Conclusions

Prototype #2’s test results really surprised me. Now its time to put it all into perspective.
The diffraction effects I was expecting to measure did not materialize. I have a few candidate reasons as to why:

  • The measurement distance of 18″ was “too close” in the sense of near-field vs. far-field.
  • The 1/2″ radius on the edges was sufficient to eliminate the diffraction, especially at the high frequencies.
  • Recessing of the driver’s isn’t taken into account by diffraction theory. (The soft dome of the Vifa tweeter is recessed below the face plate.)

Copyright © 1999 John Lipp

Speaker III – Prototype Cabinet #1

Although I made initial tweeter evaluations on large panels, the final speaker design decisions have to take into account the cabinet shape. Why? In the movie Fire Fox Clint Eastwood had to think in Russian. As a speaker builder you have to learn to think in terms of wavelength . One of the audio “rules of thumb” is any object within one wavelength will have an affect on the corresponding frequency range. (However, in my experience, the frequency corresponding to half of a wavelength is more likely to be affected.) The frequency corresponding to a wavelength is computed via

frequency = (wavelength) x (speed of sound)
The speed of sound in air is about 345 meters / second; a typical cabinet front is 0.15 meters to 0.5 meters in width. This translates into a frequency of 2.3 kHz to 700 Hz. That is, the edge of a cabinet is acoustically “close” to the drivers and it affects the way sound radiates from a loudspeaker in the critical mid-range.

Prototype #1 Description

The design of the this prototype was motivated by the feasable shape that a center channel is allowed. The cabinet pictures with drivers mounted show that this design is pretty similar to many speakers on the market. The cabinet exterior dimensions are 8″ width, 18.5″ height, and 11.5″ depth. The construction material is 3/4″ particleboard (bookshelfs) and is doubled up in the front for the driver baffle. The left and right baffle edges are routed to 1/2″ radius corners. Internal bracing every 4″ is attatched to the sides, top, and back.

Front View Side View
cabinet_testing_front cabinet_testing_side

Tweeter positioning tests

These tests were performed without the double (1.5″) front baffle, or any of the internal bracing. The first test was with the tweeter positioned in the center of the baffle.
Immediately noticable is the dip between 2.5 and 3.5 kHz.
VifaB_Center1
The same measurement with a little longer time window:
VifaB_Center2
Now, move the tweeter so that the ratio between between the left and right sides is 2 to 1.
However, the definition of the distance to the left and right sides needs some clarification.
First, the edges of the cabinet are rounded, so the “edge” of the cabinet is where? Is it the point on the side where the curve ends? The middle of the corner? The beginning of the corner? Second, should the distance from the edge be measured from the center of the tweeter, or from the edge of the tweeter? I just wish I could remember what I did for this test!

The results of the measurement show that the center of the baffle is not the best location
for a tweeter. The dips in the 2.5 kHz to 3.5 kHz region are now almost gone.
VifaB_2to1
The most prominent anomyly in the response is at 3 kHz. A waterfall plot of this impulse response shows that this frequency has a substantial time span. The wavelength at 3 kHz is 11.5 cm, which does not corrspond to any physical structure, nor does half of this wavelength. But 11.5 cm is for a wave traveling in *air*, not in a solid material. Thus, my conclusion was the peak at 3 kHz was most likely due to a cabinet resonance. Ergo, bracing of the cabinet, even when made out of 3/4″ particle board, was going to be necessary.
VifaB_2to1_Wfl

Final Raw Driver Measurements

Can’t remember the measurement distance. The mid-ranges are wired in parallel for this test.  No data on output signal level. With a time measurement window of 7.3 ms, the response is affected by reflections from within the room (the squiggling on the responses).
VifaMids
Both response curves show a two major dips in the 2 – 10 Khz frequency range. Further testing is being conducted to locate the source (diffraction, the speaker stand, driver problems, etc.). One area of suspicion is the mid-range; the tweeter positioning tests were made without the mid-ranges present. Consider the table of length-to-frequency conversions:

Distance Measurement Full Wavelength
Frequency
Half Wavelength
Frequency
Mid-Range
Cone Depth
1″ 13.5 Khz 7.3 kHz
Mid-Range
Cone Width
3.5″ 3.9 Khz 1.9 Khz
Distance from
Tweeter to
Mid-range Surround
2″ 6.8 kHz 3.4 kHz
Distance from
Tweeter to
Right Edge
2-3″ 4.5-6.8 kHz 2.3-3.4 kHz
Distance from
Tweeter to
Left Edge
4-5″ 2.7-3.4 kHz 1.4-1.7 kHz

From the dips in the tweeter response, the possible culprits would be the recessed nature of the mid-ranges, and the distance from the tweeter to the mid-range edge. The latter suggests that recessing the mid-range deep enough to “hide” its surround from the tweeter waveform might be desirable.


Copyright © 1998,1999 John Lipp