New Sub – Onkyo Calibration OFF

I had been doing some experimentation with the subwoofer’s electrical polarity and obtaining results that didn’t seem to make sense.  Reversing the polarity was giving better results.  So I decided to investigate the impact of the Onkyo TX-NR545 calibration.

Onkyo EQ On and Off

The green curve is the baseline.  Notice how nice and flat the bass is from 40 – 80 Hz.  This is the result of inserting the SVS AS-EQ1 into the subwoofer audio loop. This unit employs Audyssey auto-correction algorithms in the bass region.  I’ve always been impressed with the AS-EQ1 – some of the best subwoofer $$$ I ever spent.

The blue curve is with the Onkyo’s equivalent auto-correction applied.  What???  Yes, I double checked this several times.  The dip at 100 Hz is being created by the equalization!  I even downloaded the latest firmware, and same result.  Pretty subpar.  So I turned off the Onkyo equalization 🙁

P.S. These measurements were with bass traps in the corners of the room.

New Sub – Now with Bass Traps

Did I mention the game room I’m using for the home theater has a lot resonances?  The formula for determining resonances in your listening room is to divide the dimensions into 50% of the speed of sound.  Sound travels around 343 m/s… temperature and humidity factor into the exact number.  That translates to 1125 ft/s, and half that is 563 ft/s.  The game room’s dimensions are

  1. 17′ –> 33.0 Hz
  2. 14′ 6″ –> 38.8 Hz
  3. 10′ –> 56.2 Hz

The L-shaped sectional couch in the game room seems to have damped the 33 Hz resonance and its multiples quite a bit.  That leaves 40 Hz as the strongest resonance.

Although resonances can be dealt with electronically via equalization, they also can be eliminated by application of damping material.  The usual place to start is with “bass traps” in the corners.  A typical bass trap is 2-6″ of high density fiberglass with usual dimensions of 2′ x 4′.  I purchased a pair from GIK acoustics along with a 40 Hz tuned membrane bass absorber.

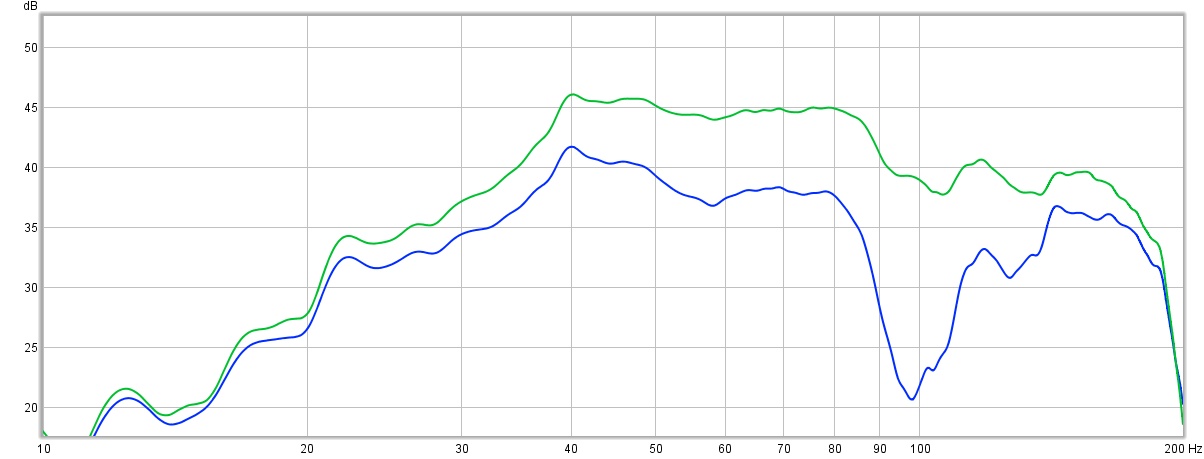
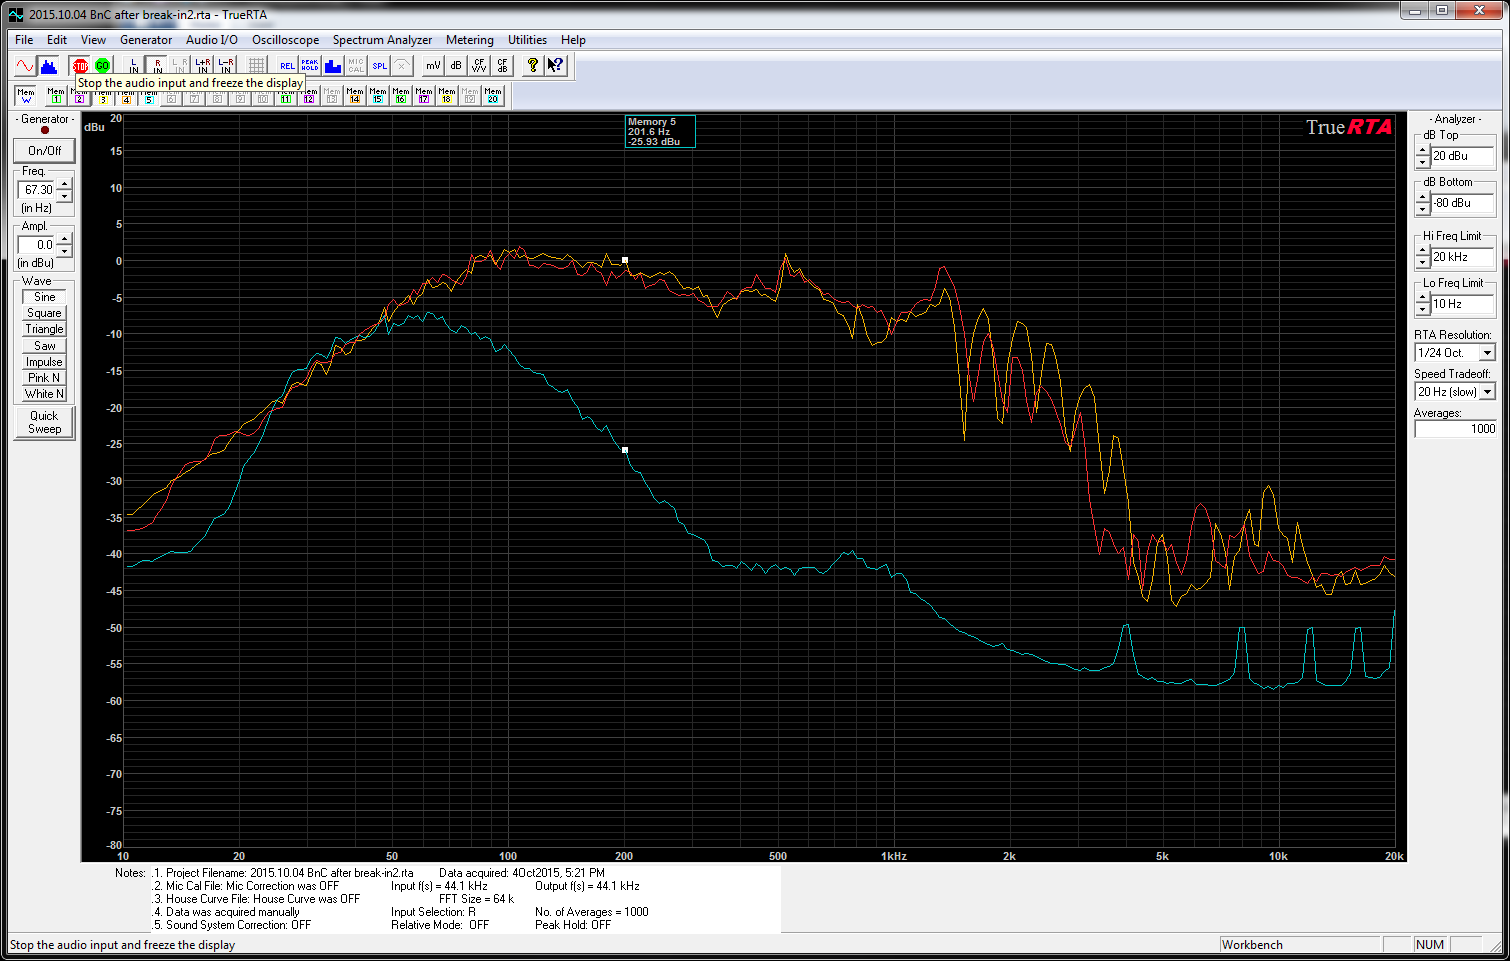
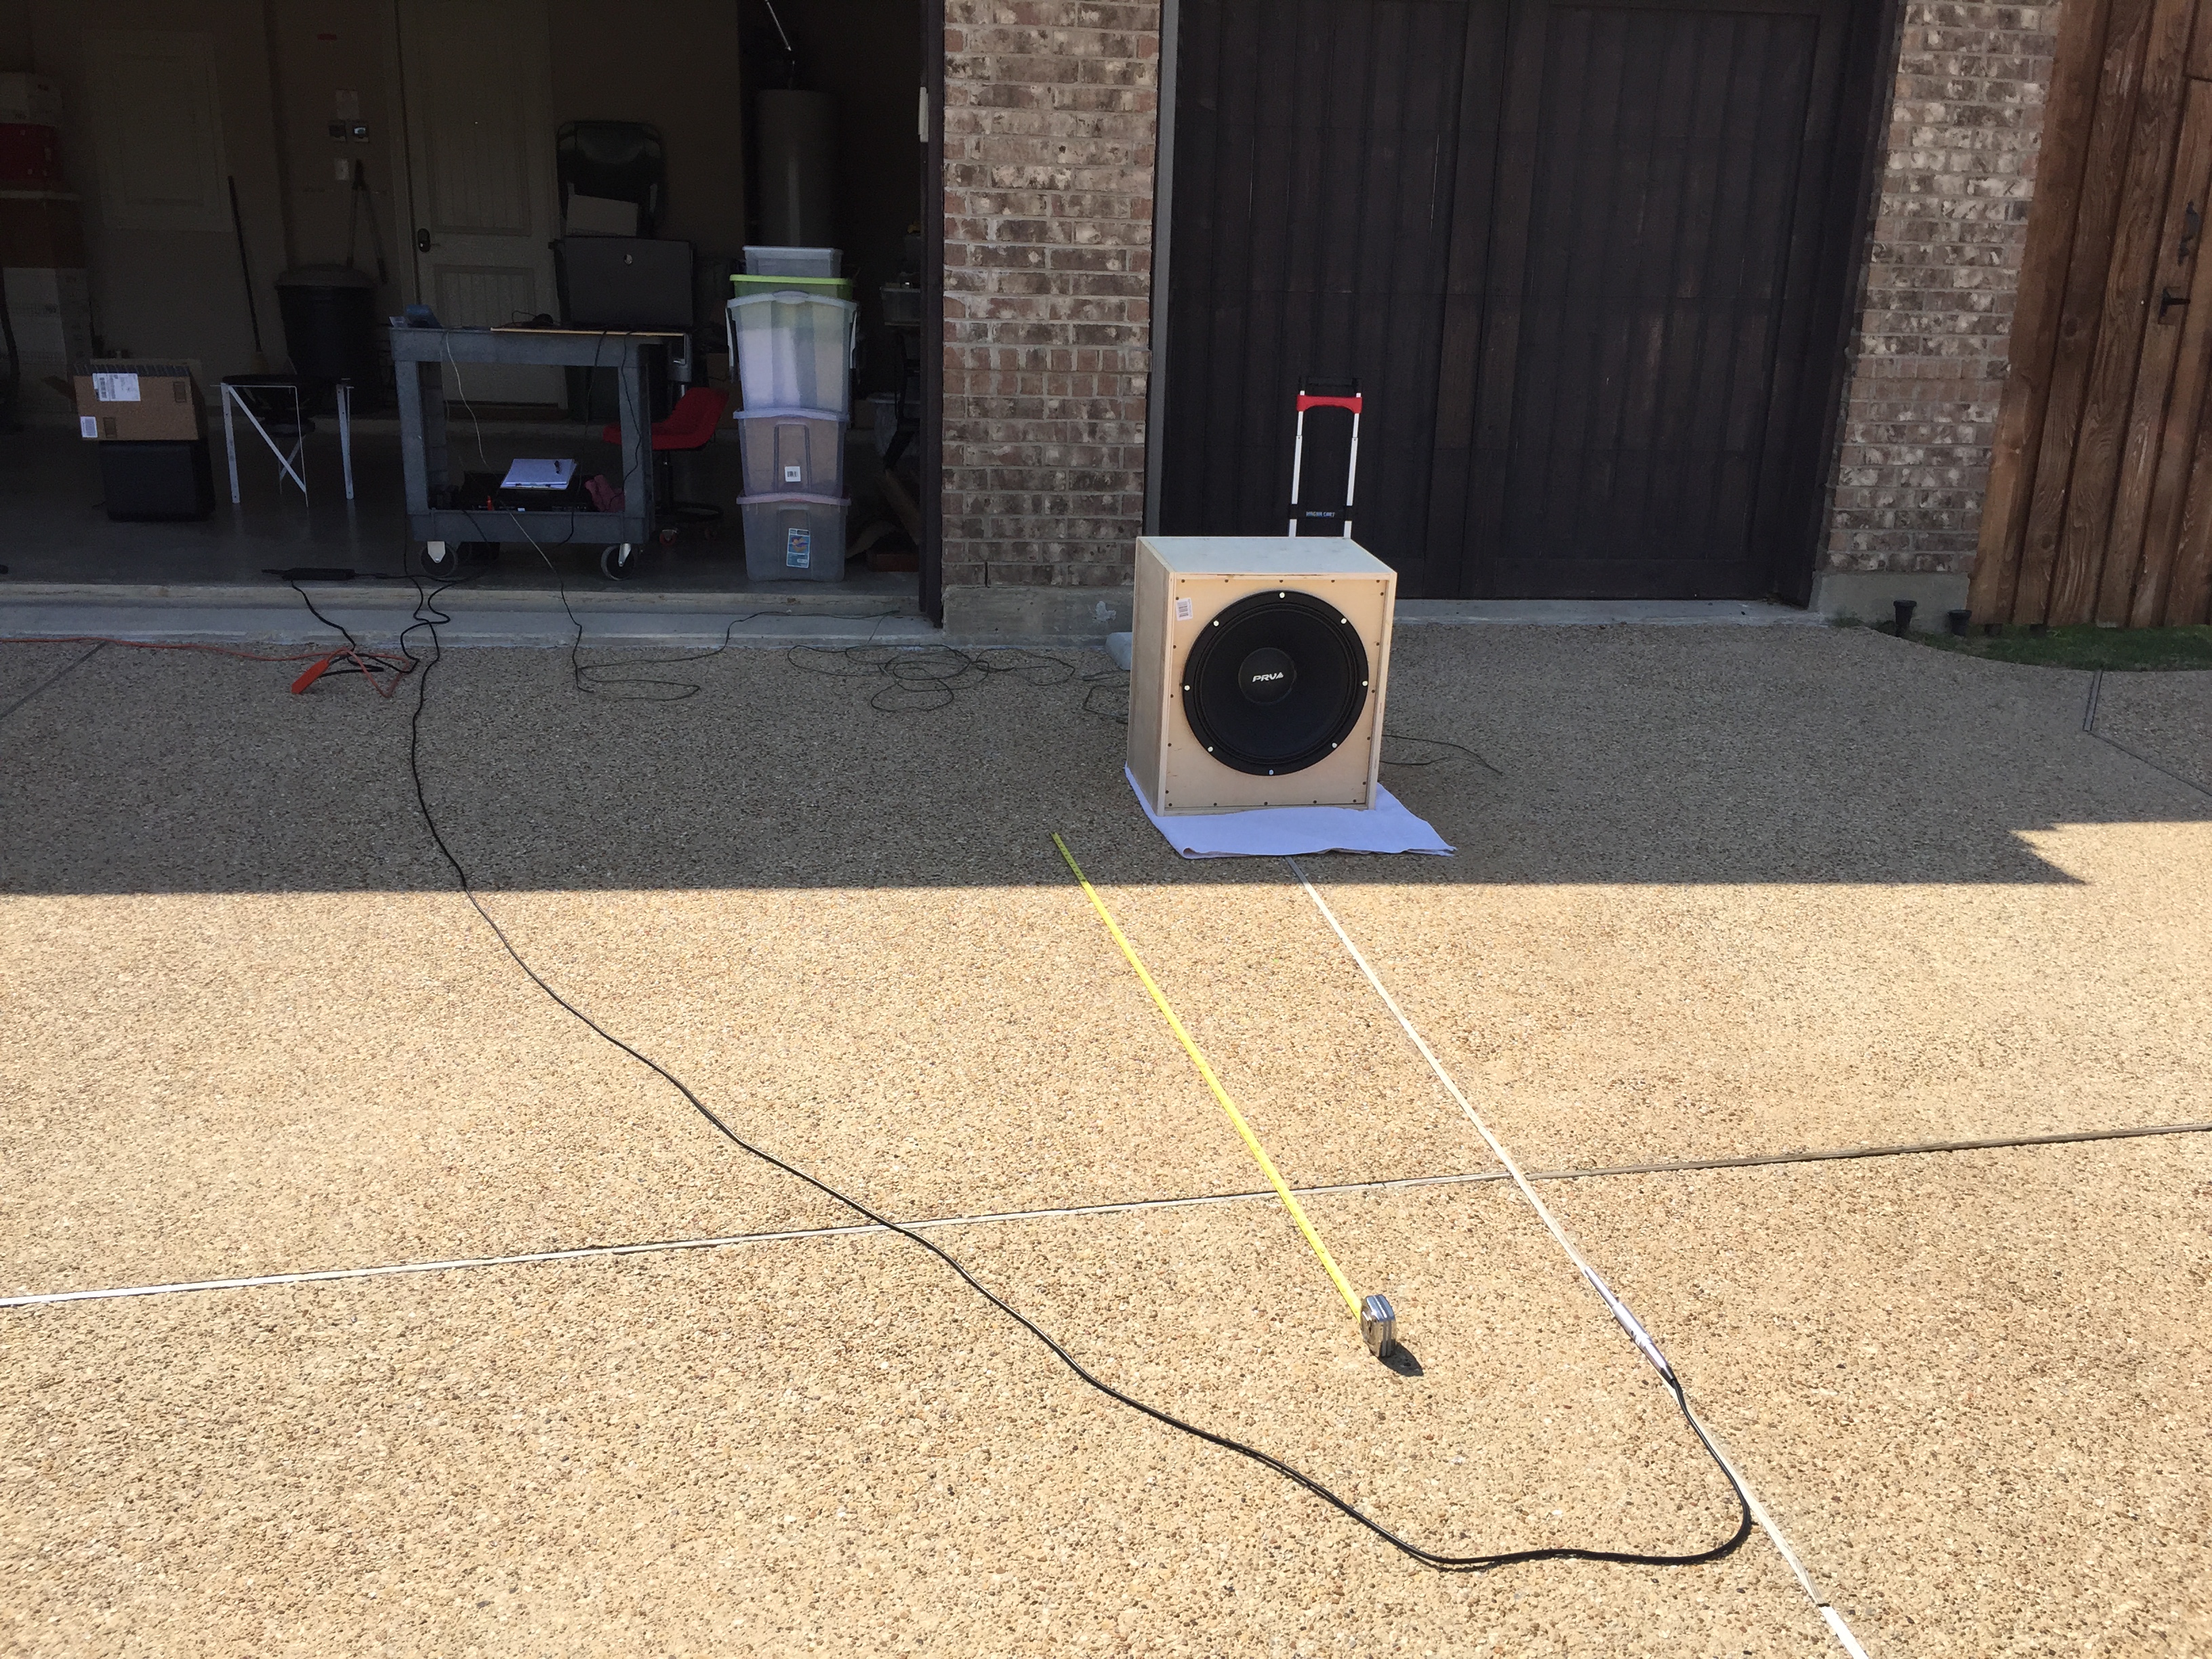
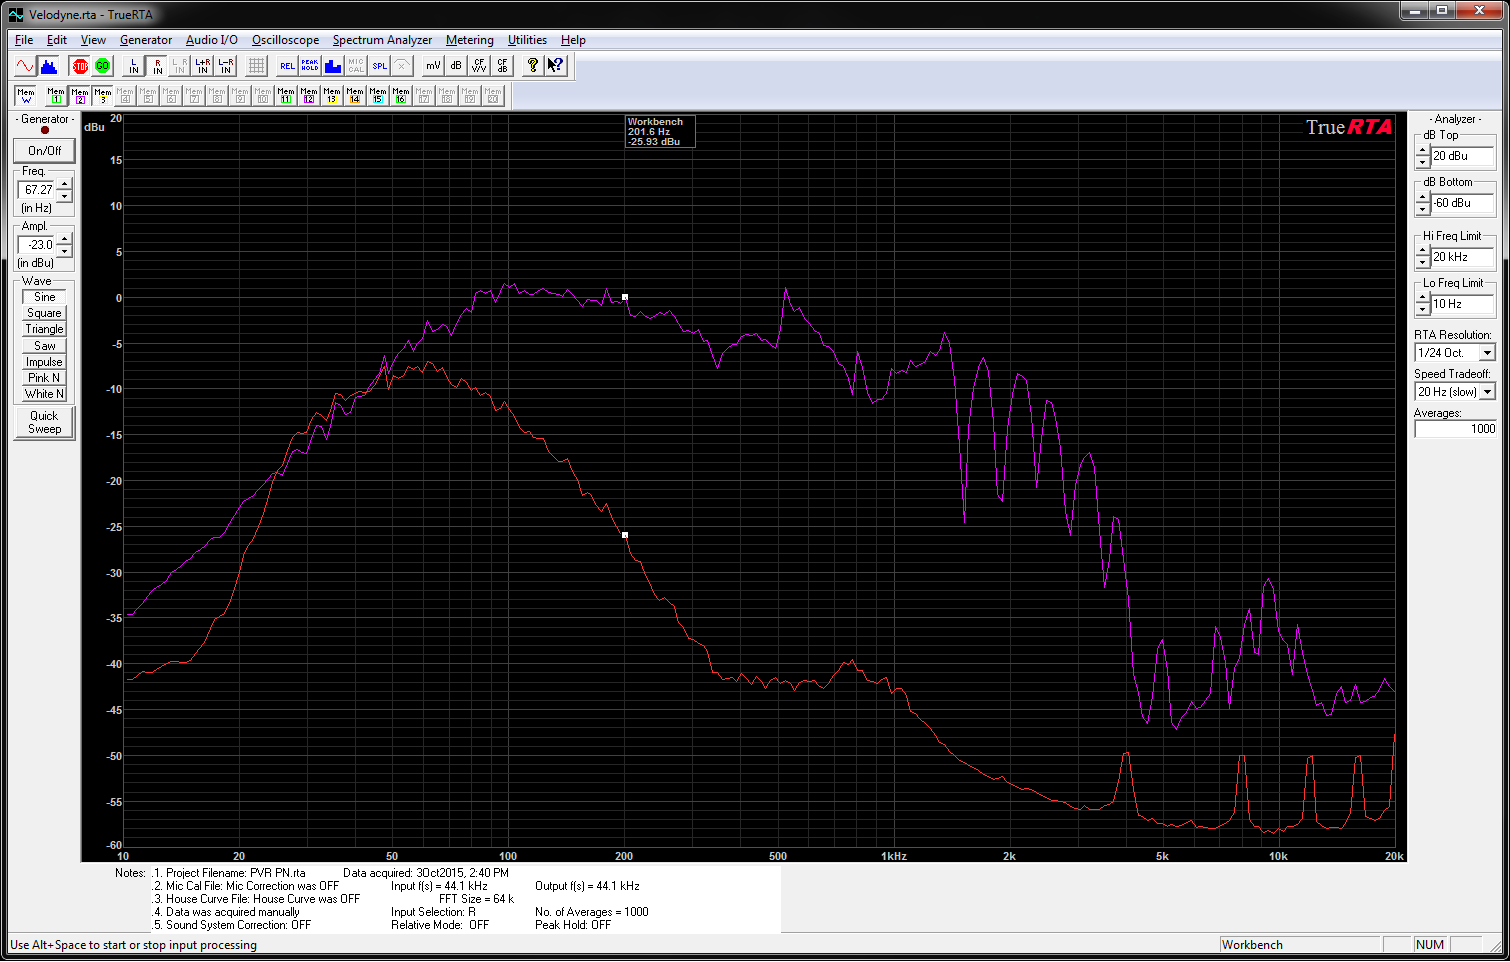
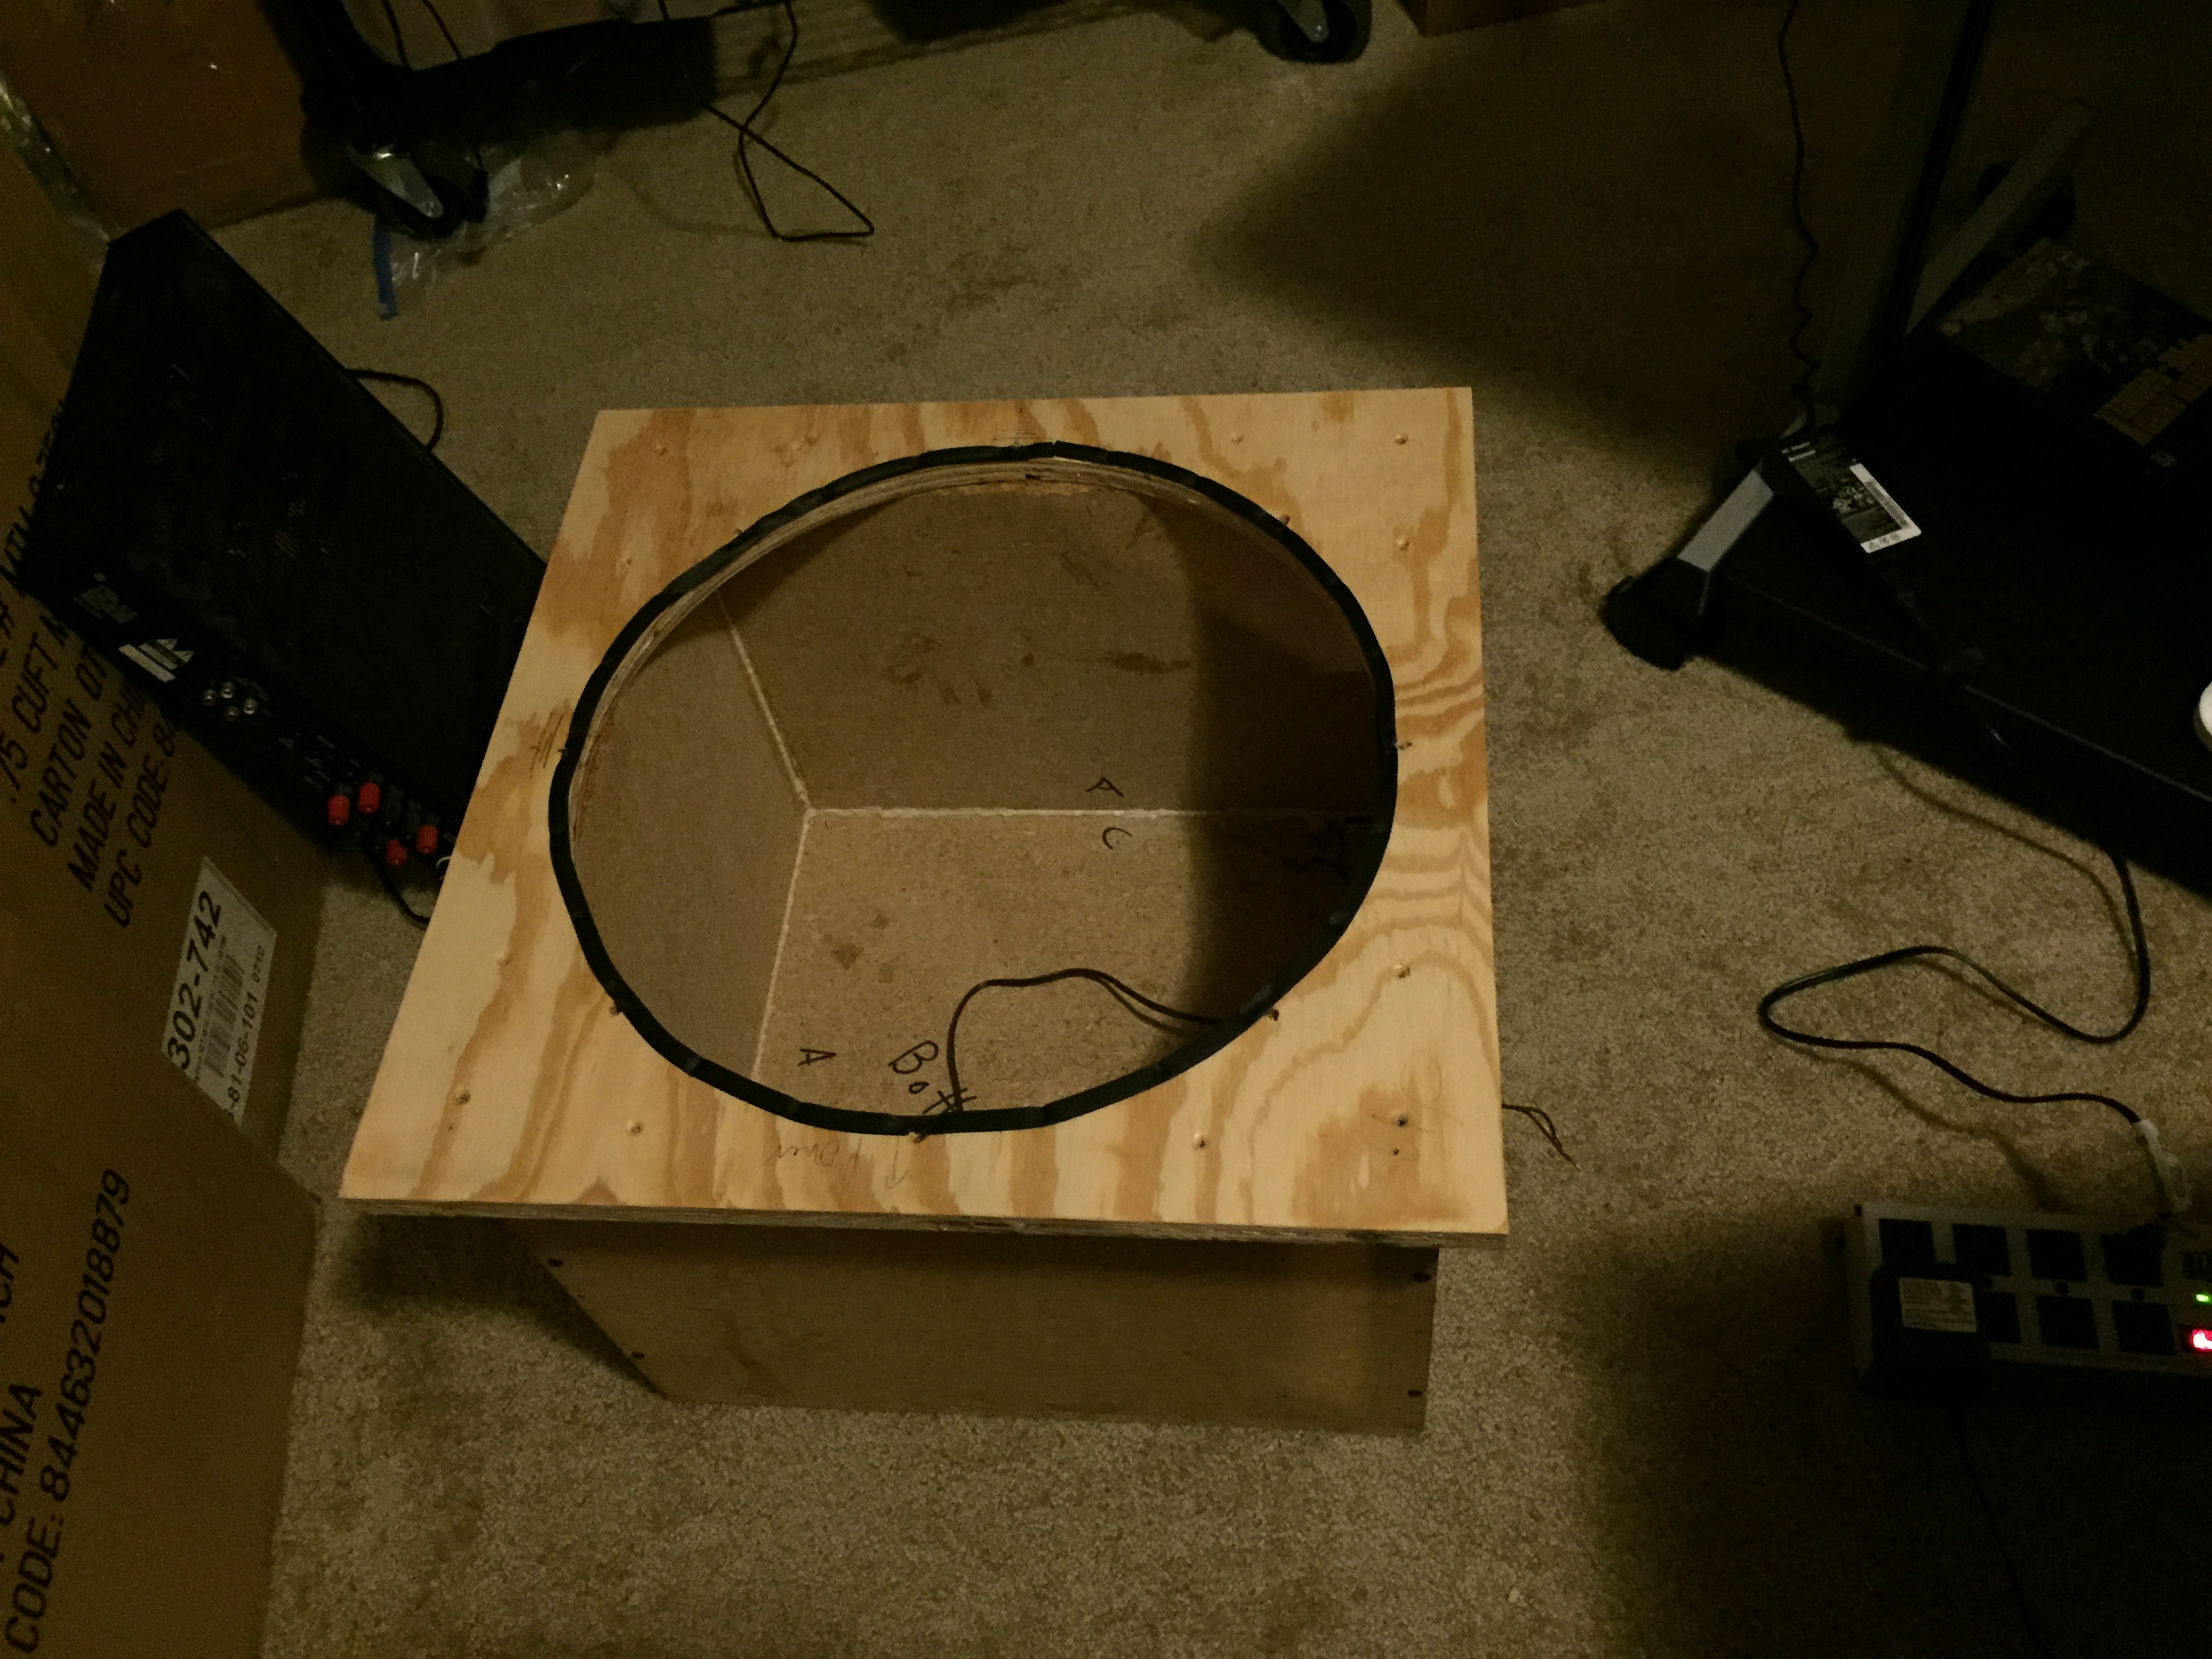
First up is the resonance absorber.  It is 2′ x 2′ x 10″.  I tried multiple positions and measured very little impact.  I finally got desperate and put the bass absorber right on top of the subwoofer.  Here is the measurement of before and after at my main listening position.

Bass Resonator Above Sub

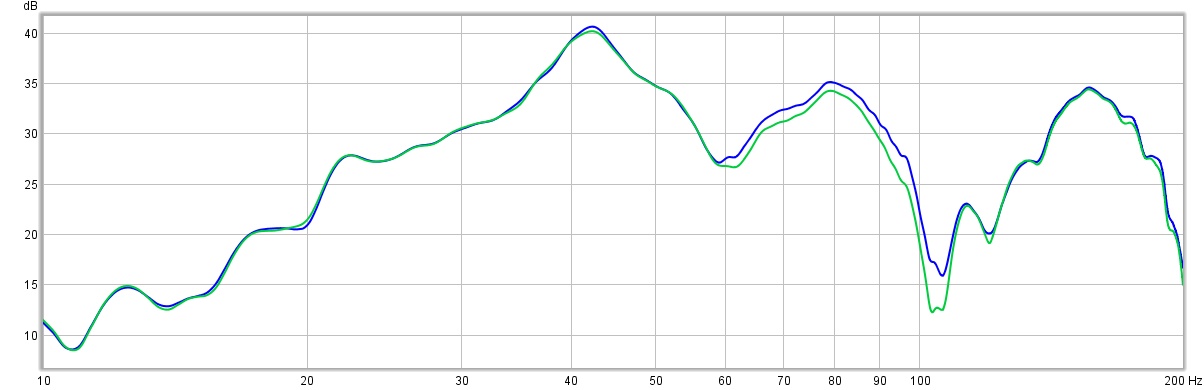
Blue is before, light green is after.  So first thing is the absorption at 40 Hz is very small.  I was afraid that this would be the case.  Specifically, that a large number of the absorbers would be required to achieve any effect.

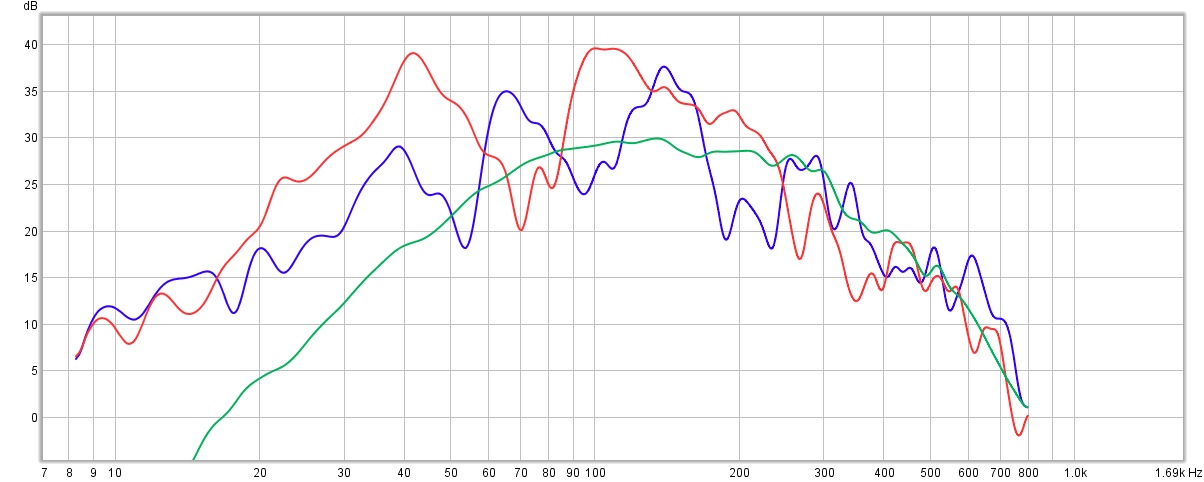
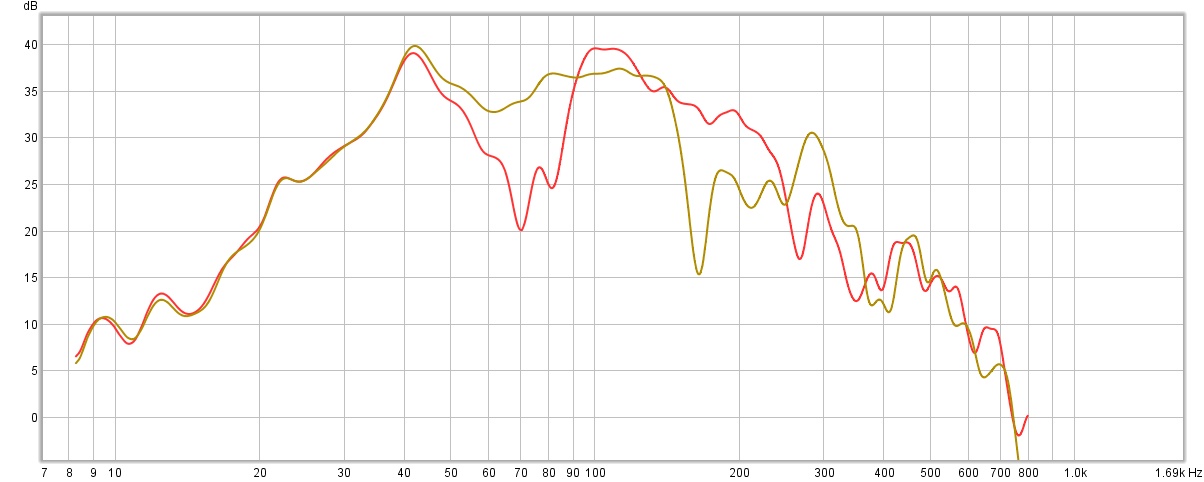
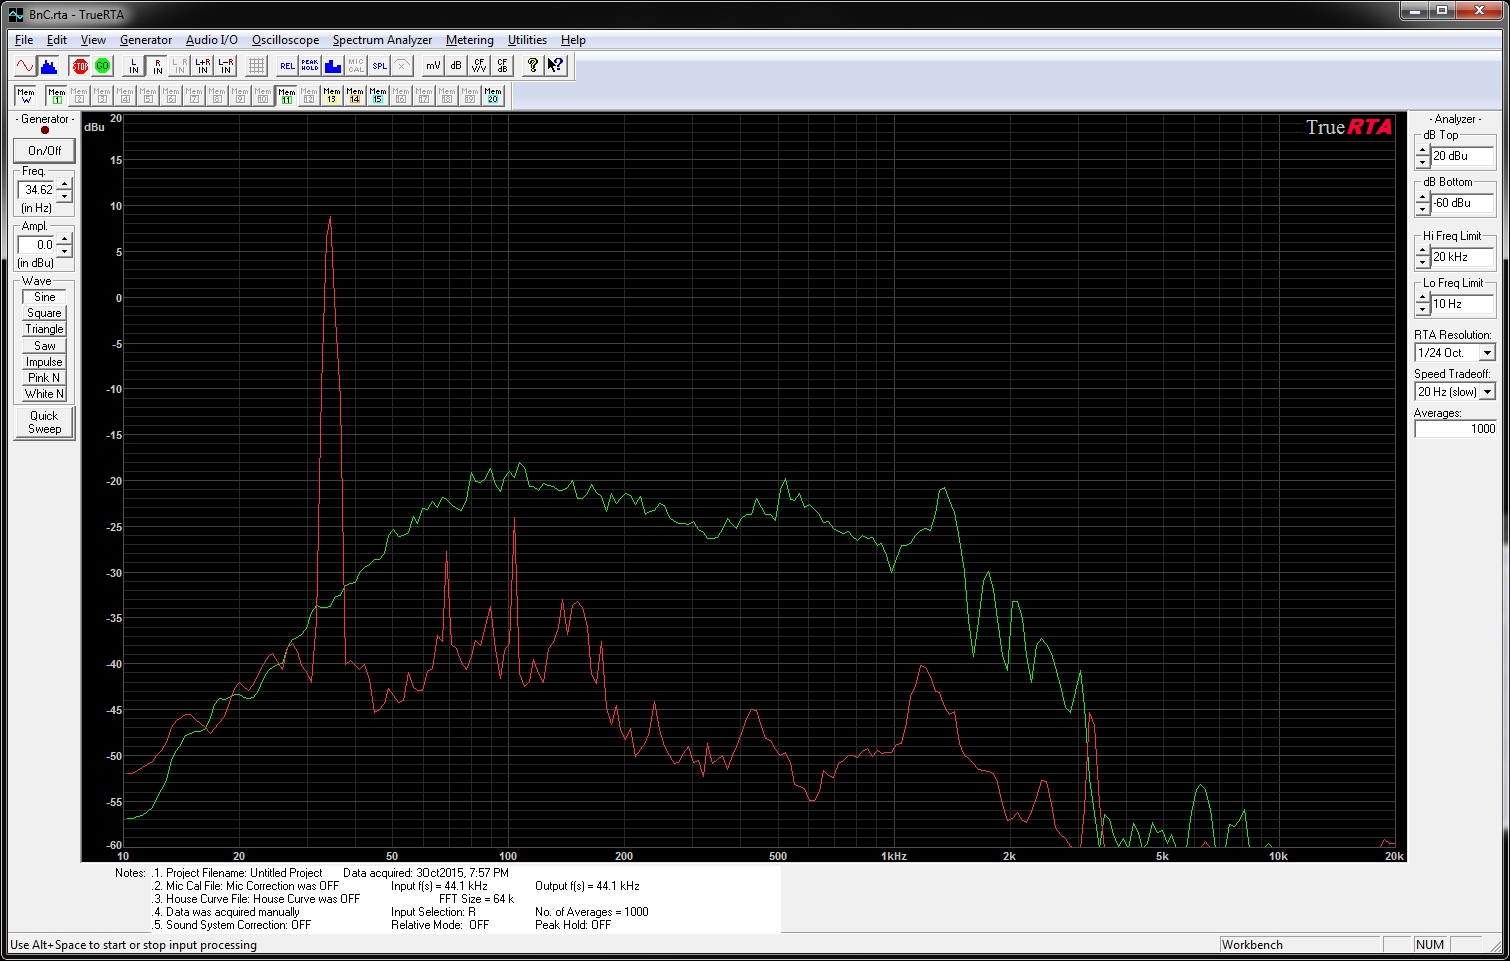
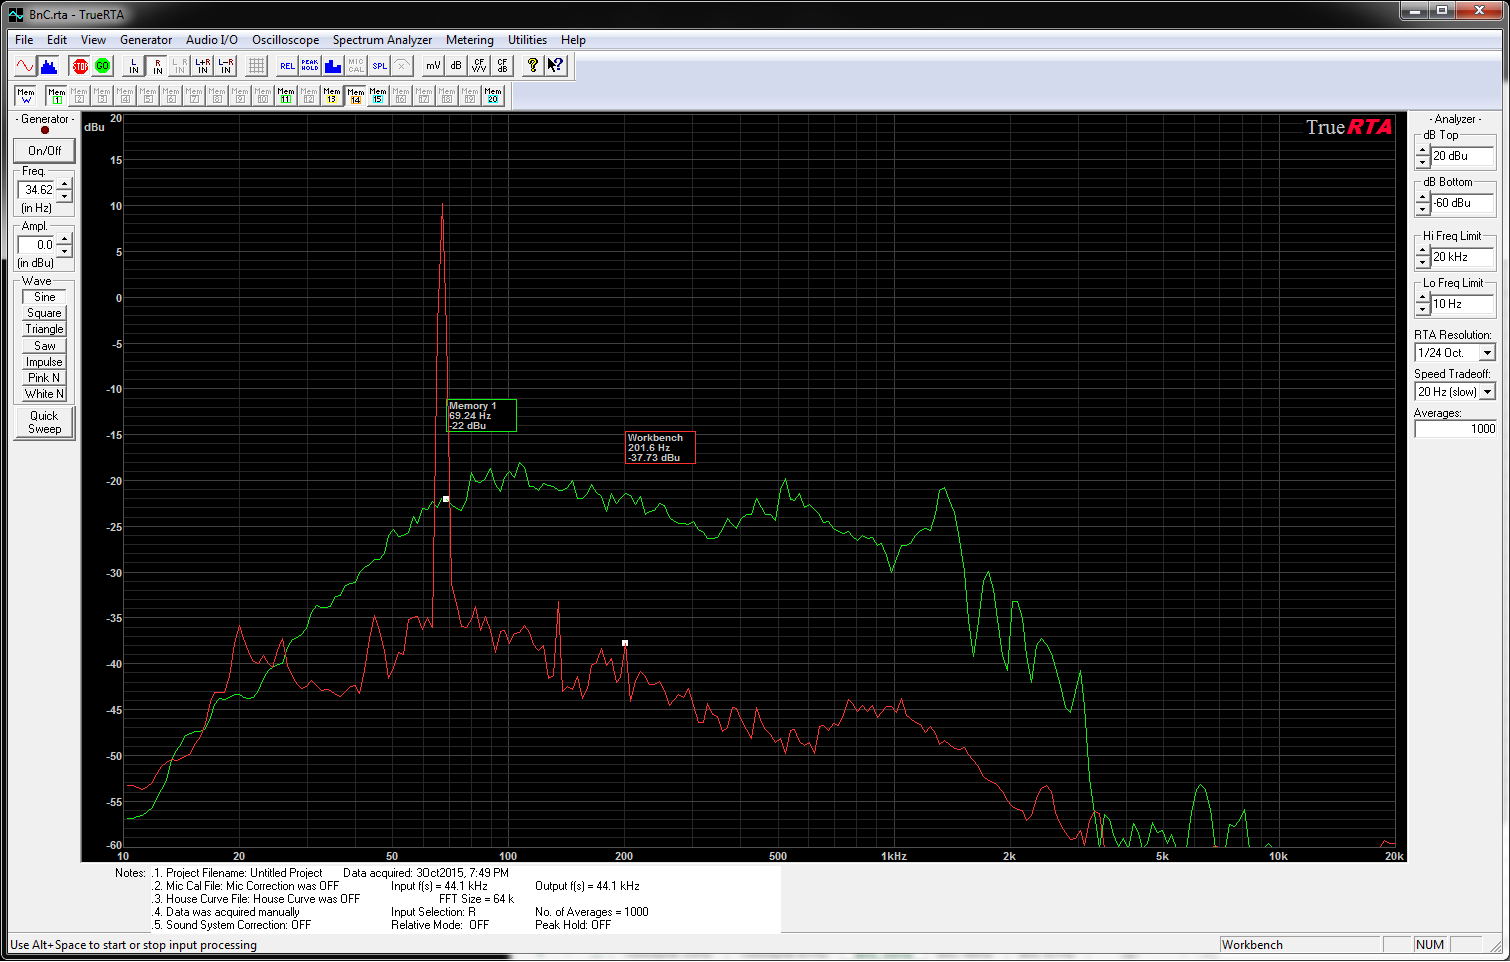
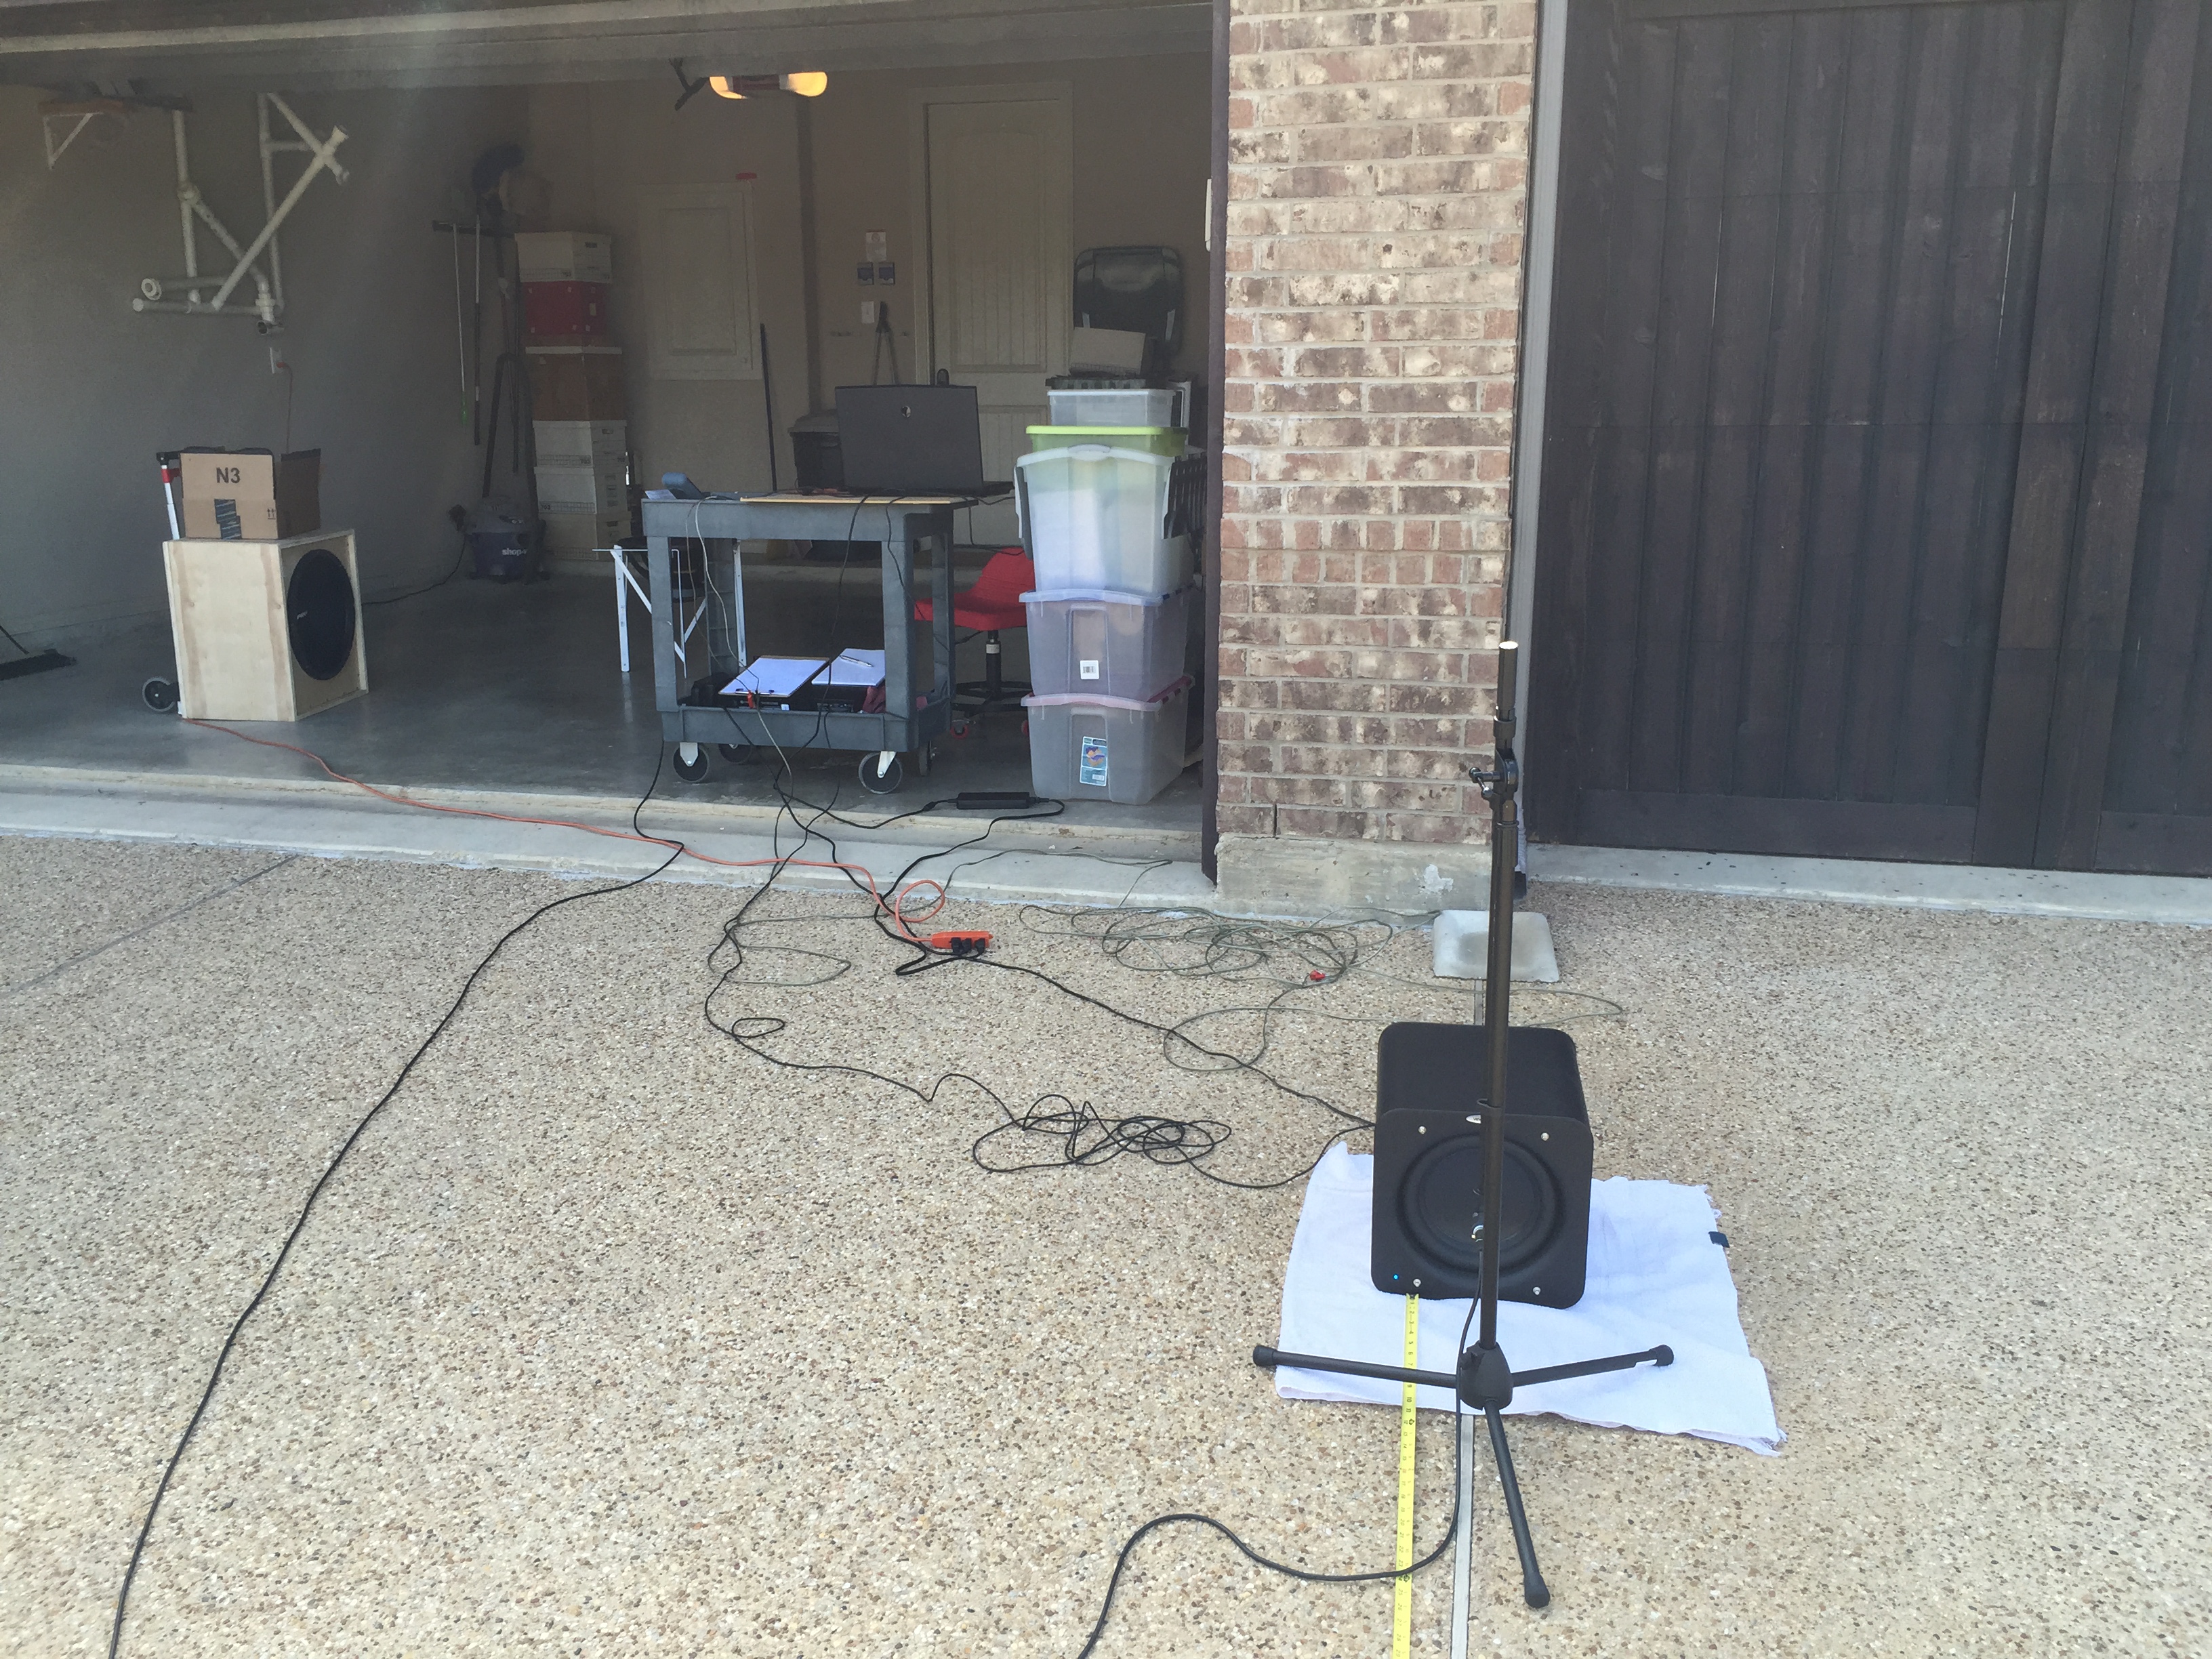
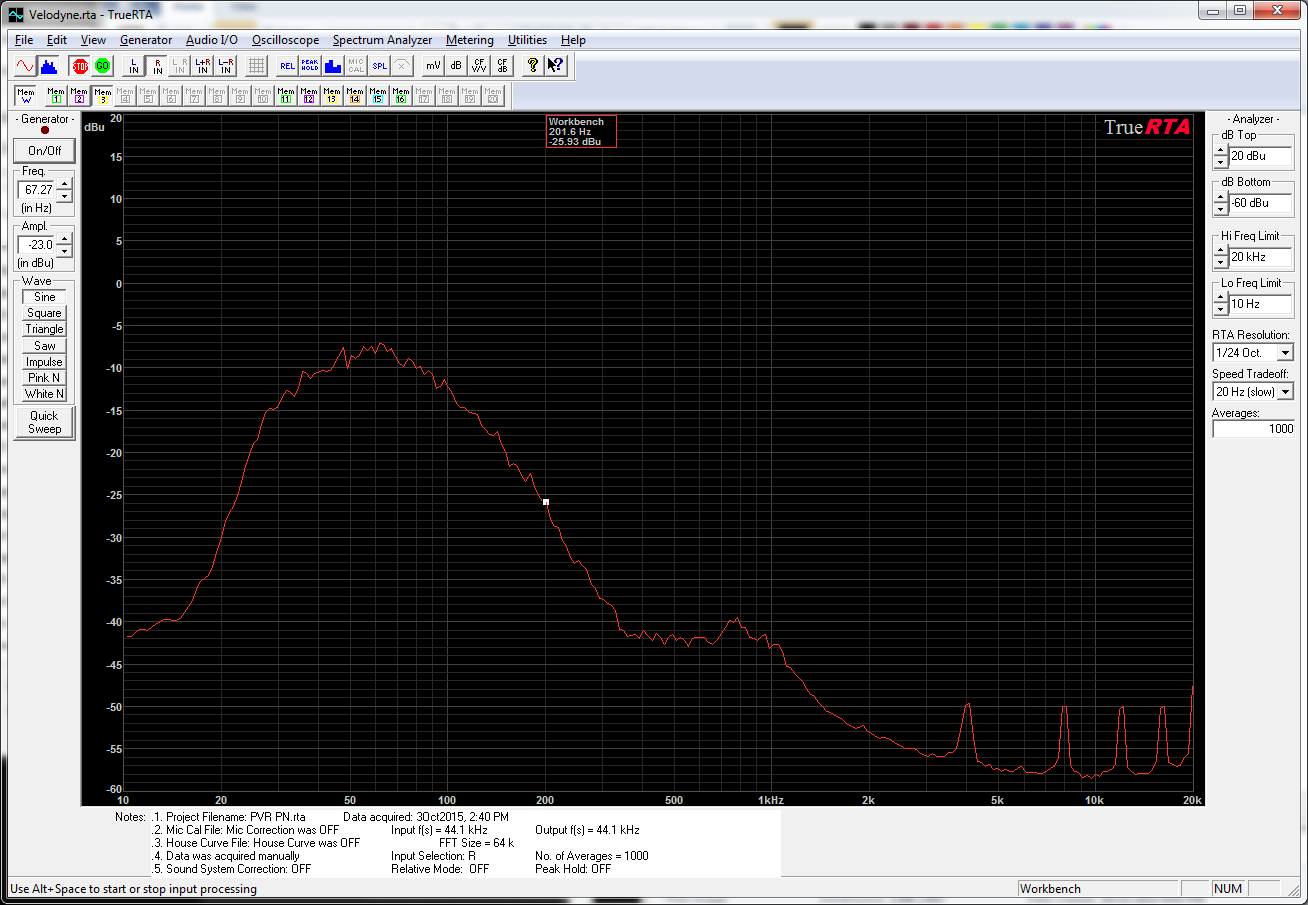
Next up are the bass traps.  The units I purchased are the usual 2′ x 4′ and 4″ thick.  They not entirely composed of absorbing fiber.  An air gap is on the back side which improves the quantity of absorption.  I also ordered the membrane option which adds a reflective membrane to the face of the bass trap.  This reflects frequencies above 400 Hz so that the bass trap doesn’t absorb them.  Here’s the measurement with a single bass trap located in the corner above the subwoofer (red) and the bass traps doubled up in the corner (green).

Bass Trap Above Sub

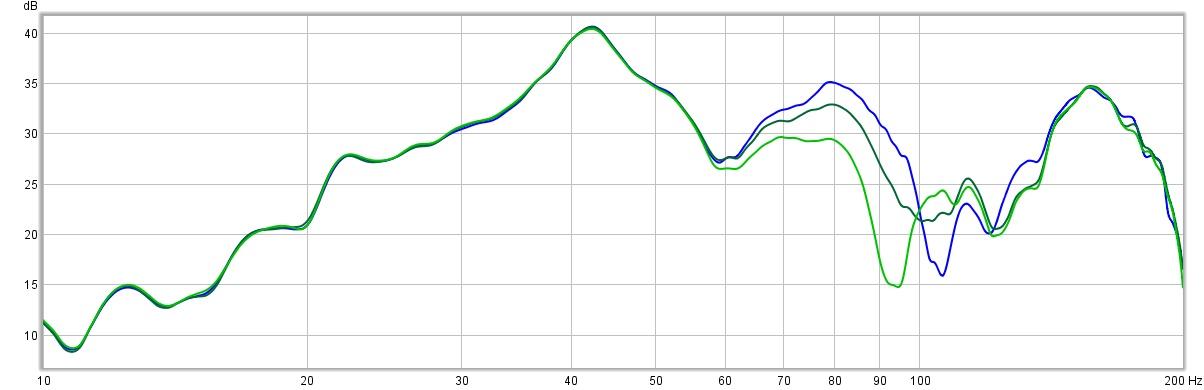
Wait, they don’t seem to absorb 40 Hz at all, how can these be called bass traps?  These results are consistent with the advertised absorption characteristics of this type of absorber.  Yeah, they don’t absorb deep bass.  The peak at 43 Hz will have to be handled with electronic filters.

New Sub – Reciprocity Test

A technique recommended for finding your optimum subwoofer position is to place the subwoofer in your primary listening position and go around the room and listen to various candidate subwoofer locations.  Today I did such a test.  Instead of listening, I used a microphone, of course.

Reciprocity Test

The three curves above are smoothed with a 1/12 octave filter.  The green curve is the raw sub measurement.  It is obtained by placing the microphone very close to the driver cone so as to swamp out the influences of the room.  The red curve is the left corner of the listening room, and the blue curve is the right corner (where the subwoofer was located in all previous tests).  The left corner is next to a couch, while the right corner is open to the room.

Which to pick?  A subwoofer in each location would be ideal.  The peaks / dips would partially cancel.  In the end, I selected the left corner.  It is smoother above 100 Hz where the subwoofer needs to integrate with the main speakers.

How well did the reciprocity hold up?  I moved the subwoofer from my primary listening position and into the corner.  (Pause, catch breath, this thing is HEAVY.)  The big dip at 70 Hz has filled in nicely, while the response above 150 Hz is rougher.  Acceptable.

Reciprocity Test After

New Sub – In the Game Room

New Sub to the Right

Sub to the right, hiding underneath the table.  Crown XLS1500 sitting on top.

Now comes the moment of truth.  What does my technological terror sound like?  Well, listening was short lived.  The Crown XLS Xi1002 kicked the bucket some time during Tron.

BnC Corner

I did manage to do some testing before the amp died.  The green curve represents the average of 6 measurements about the game room couch at ear level.  The dark blue curve is the close mic’ed response shifted to match the general characteristics of the average measurement.  The red is the difference of these two.

The obvious is the broad peak F1 centered at 40 Hz.  This is a very pronounced room resonance with a long decay corresponding to the room dimension of 14′.  Very unpleasant.  (The room also has a dimension of 17′ on the long size, but it opens to a stair well and a bathroom, so no mode observed at 33 Hz…)  There is a smaller resonance H2 at 80 Hz, and a possible dip H3 at 120 Hz.  The next trend – and this is a good thing – is the gain of +9 dB / octave below 50 Hz.  This partly counteracts the 12 dB/octave roll-off of the sub below 67 Hz.  Over-all this is a very extended in-room bass response.

I purchased a new amplifier – a Crown XLS1500 on sale at Guitar Center.   Ran the AutoEQ feature of my Onkyo receiver.  The AutoEQ algorithm plays a series of noise bursts, equalizing between bursts.  You could hear it extend the final half-octave as it iterated and optimized its filters.  I’ll have to take measurements later.

Next I played a couple of flicks – Tron, Operation Swordfish, House of Flying Daggers, and Pearl Harbor.  The scene in HoFD with the drums is just amazing.  Tight.  The aircraft roars in PH are clear, no excessive rumble.  Quite a bit of cone motion during the various explosions.  The gun fire is somewhat muted in the sound track, so doesn’t have quite the impact it could.

New Sub – The B&C 18″

Next up is the B&C.  Start with the frequency response, measured with the mic close, with pink noise, and averaging 1000 times.  The Velodyne and PVR responses are shown for reference.  Can you tell which is the PVR and which is the B&C?  I double checked my notes, so not sure why these look the same, other than I must have over-wrote the PVR data 🙁

BNC Response

Now for the good stuff, the distortion measurements.  These were difficult due to the high output and the driver.

  • 35 Hz, 17″, 2.83 vRMS –> 2.7%
  • 35 Hz, 39″, 5.9 vRMS –> 4.2%
  • 35 Hz, 79″, 12.9 vRMS –> 8.1%
  • 35 Hz, 79″, 22.5 vRMS –> 11.7% at an estimated 3.6 mm peak displacement
  • 49 Hz, 39″, 2.83 vRMS –> 1.1%
  • 49 Hz, 79″, 5.92 vRMS –> 1.5%
  • 49 Hz, 79″ + reduced mic gain by -6 dB, 12.9 vRMS –> 2.93% at an estimated 1.9 mm peak displacement
  • 67 Hz, 79″ –> 0.56%
  • 67 Hz, 79″ + reduced mic gain by -6 dB, 5.95 vRMS –> 1.3% at an estimated 0.95 mm of displacement

Why the additional measurement at 49 Hz?  I have a theory as to why the distortion measurements are much higher at 35 Hz than 49 Hz.  First, the displacement isn’t higher vs. the drive voltage for the two frequencies.  This is because below the box tuned resonance of 67 Hz displacement flattens out.  Not the same for output.  Consider this picture of distortion vs. transfer function:

BnC 35 Hz dist

Notice the gain at 60 Hz is almost 12 dB (4x) higher than at 35 Hz.  That is, when taking a measurement at 35 Hz, the second harmonic is getting amplified !!!  The same thing does not happen at 67 Hz.

BnC 67 Hz dist

New Sub – Measuring the PVR 18″

Next up for testing is the PVR Audio 18SW2000 in a 3 cu.ft. (net) enclosure.

2015-10-03 13.43.02

First up is the frequency response measurement.  Performed with the mic close-up, using pink noise averaged 1000 times.  Red curve is the Velodyne for reference.

PVR Response4

The Velodyne subs have a built-in amplifier.  To match up with the PVR I carefully recorded the gain settings on the microphone.  I dialed in the PVR at +6 dB higher than the Velodyne to account for the fact I have two of the Velodynes and I am looking for a net improvement over the pair.

THD test results – not an improvement !

  • 35 Hz, 17″, 2.83 vRMS = 1.6 watts into 5 ohms –> 4.5%
  • 35 Hz, 39″, 5.92 vRMS = 7.0 watts into 5 ohms –> 7.4%
  • 35 Hz, 79″, 12.93 vRMS = 33.4 watts into 5 ohms –> 16.6%
  • 67 Hz, 17″ –> 2.0%
  • 67 Hz, 39″ –> 2.0%
  • 67 Hz, 79″ –> 3.9%

New Sub – Establishing a Baseline

My current home theatre setup uses a pair of Velodyne MiniVee 10″ sealed subwoofers.  So the first step is to take some measurements of the Velodynes as a performance baseline, that way I know I am getting an upgrade.

2015-10-03 14.36.19

Took one of the two subs out of the system for testing.  Testing starts with a close mic frequency response test.  Method was pink noise, averaged 1000 times.  A lot of averaging was required to counter the sounds of cars passing out on the road.

Velodyne Response

Next I wanted to test the distortion at a couple of frequencies.  I picked 35 Hz and 67 Hz as two frequencies easily within the capabilities of the sub.  My current microphone pre-amp doesn’t have a low-enough gain setting for testing at large signal levels, so I had to carefully manage the signal level.  The first measurement is at a distance of 17″ with the microphone on the ground, making it a ground plane measurement.  The signal level is increased +6 dB, and the distance doubled to compensate.  Then repeated again.  The results:

  • 35 Hz, 17″ –> 3.5% THD
  • 35 Hz, 39.4″ –> 8.1% THD
  • 35 Hz, 78.8″ –> 15% THD
  • 67 Hz, 39.4″ –> 1.0% THD
  • 67 Hz, 17″ –> 1.0% THD
  • 67 Hz, 78.8″ –> 1.0% THD

The SPL guesstimate is 90-91 dB @ 2 meter ground plane for the 78.8″ test cases (equivalent to 90-91 dB at 1 meter in half-space).  Obviously very nice results at 67 Hz, the Velodyne isn’t sweating at all.  The 35 Hz is a challenge.


New Sub – B&C 18TBW100

My instincts are telling me that the PVR Audio 18SW2000 is not going to work out for my project goals.  Not enough Xmax.  Not even close.  Also, the Vas is larger than advertised, the appropriate box for a Qtc of 0.707 is more like 3.0 cu.ft. and the fc will then be around 67 Hz.

So I started looking for an alternative 18″ driver.  After reading various reviews, the B&C drivers looked like a good candidate.  Their 18TBX100 came out a few years ago.  Reviews consistently said “this is the 18″ pro sub driver to beat.”  Then B&C came out with the 18TBW100 to one-up their own accomplishment.  The spec sheet is impressive.  Mechanical limit is over +/- an inch without damage!  B&C also measures what they call Xvar, the point at which one or both of the suspension or magnetic circuit have diminished to 50% of the small signal values.  The magnetic circuit also has shorting rings so that high power levels don’t contribute as much distortion.  This is a feature I see in all the top tier sub woofer drivers – pro and home theatre.  The cost is double the PVR Audio 18SW2000… and I’m guessing its twice the driver.  Just what I need!

BnC 18TBW100 specs


New Sub – PVR Audio 18SW2000

So the PVR Audio driver showed up today.  Chester was interested in it of course, had to scent mark daddy’s new toy.

2015-10-11 19.16.18The first test is for basic Thiele-Small parameters.  I tried the test with the driver sitting on the carpet, but alas the magnet system is vented (for improved power dissipation) as shown below.  Blocking the vent causes the parameters to change due to the air flow restriction.

2015-10-11 19.32.57

The fix was easy… went to Home Depot and picked up some shelf brackets.  Mounted four of them and created essentially a set of stilts to raise the driver up.

2015-10-11 19.39.56

Parameters were measured with a small signal test.  To measure Vas a set of 16 nickels (80 g) were placed on the driver.  Results (compared to spec sheet):

  • fs = 33.0 Hz (vs.38.4)
  • Qts = 0.35 (vs. 0.36)
  • Vas = 246 liters (vs. 173)
  • Sensitivity = 97.6 dB (vs. 97)

Next, I tried to measure distortion.  The configuration is with the stilts above.  I wanted to look for the 10% level, since this is considered the maximum output level.  At a test tone of 50 Hz, the distortion reached this 10% distortion level with a 9.08 vRMS –> 10.3 watts into 5 ohms.  I used a displacement simulator and came up with only 1.76 mm peak one way.  That is only 25% of the rated Xmax!  Hmmm.  Could this be the room effect (the room has resonances at 34, 67, 102, etc. Hz) or operating in free air?

The later is a quick fix, I already had a 2 cu.ft. test box handy from my college days.  I made an adapter plate for an 18″ driver and repeated the 50 Hz measurement.  Distortion dropped to 3.34% at an input of 9.1 vRMS and an estimated displacement of 1.25 mm.  As I increased the volume my microphone pre-amp saturated and wouldn’t go any lower in volume.  So I switched to a 30 Hz tone.  The 10% THD level was reached at around 12.35 vRMS with 1.70 mm of estimated displacement.  Again, hmmm, not what I was expecting.

2015-10-11 19.33.23

New Sub

I wanna new sub, one that will make the earth quake, and my heart jump.  My current home theatre setup uses a pair of Velodyne MiniVee 10″ sealed subwoofers.  They aren’t too bad, but I never felt they did an adequate job of the last half-octave in the 20-80 Hz LFE range.

So how to proceed?  I have always liked sealed subwoofers.  That requires moving a lot of air, so why not an 18″ driver, the big boy?  I also thought the approach of Bagend to use a professional driver with electronic equalization was an interesting approach.  The sensitivity of pro 18″ woofers is in the 95-99 dB range compared to the 84-92 dB range for home theatre products.  The box size is kept reasonable by tuning to relative high frequency.  Electronic equalization is used to make up the difference.  In the case of Bagend, they equalize down to 8 Hz !!!  That’s really low, and from reviews I have read requires at least two 18″ drivers for a home theatre setup.  My goal is more modest, say 16 Hz would be nice, 20 Hz more realistic, with one 18″ sub.

So I started to poke around Parts Express and see what they had in the pro 18″ department.  The target was a box size of 2 cubic feet and a sealed Qtc of 0.707.  That put the cut-off frequency of 75-85 Hz for the candidate drivers suitable for a sealed enclosure (many pro drivers are designed for vented or horn enclosure designs).  A sealed enclosure rolls off at -12 dB for each octave, so the amount of equalization required would be expected to be +12 dB at 40 Hz and +24 dB at 20 Hz for a 64 Hz target cut-off.  That’s a lot!  Assume a 97 dB efficiency, then to operate at 100 dB would require about 2 watts above 80 Hz, and around 512 watts at 20 Hz by these numbers!  Assuming of course that the driver has enough Xmax.  That is around 8 mm of driver excursion for an 18″ driver.

One of the candidate drivers was on sale, the PVR Audio 18SW2000.  It would achieve a 82 Hz box tuning in 2 cu ft (actually a little less).  Xmax looks good.  Power handling more than enough.  The frame is cast, not stamped.  And did I mention it is on sale?

PVR Spec Sheet