It is finally time for the fun part of speaker design. In the introduction I set a goal for myself of trying to acheive a constant group delay. Some of you have to be wondering what I’m talking about. Group delay is the engineering term used to describe the average time delay over a range (i.e., “group”) of frequencies. In this case the interesting group of frequencies is the mid-range centered around 1 kHz. An ideal speaker should have a constant time delay at all frequencies (the time it takes for the sound to travel from the speaker to the listener, to be exact). Thus, the goal.
One way to acheive a constant group delay is with an acoustic first order crossover between mid-range and tweeter. The word acoustic should be emphasized: not all first order electrical networks result in a first order acoustic response. The driver’s own natural response always interfers to some degree. Unfortunately, first order filters have limitations. Their gentle slope does not provide good power protection for tweeters. A low crossover frequency needed for a two-way design like Speaker III is obtainable only with tweeters specially designed to survive long and frequent mechanical excursions. Standard tweeters, such as the Vifa D27SG-05 I’m using, sound “nasally” near the crossover point when used this way. (Three-way designs aren’t so problematic.) In addition, a substantial amount of driver frequency response overlap is required to obtain a flat frequency response. It is not uncommon for 2-way first order designs to end up with a frequency response hole or dip just below the crossover frequency.
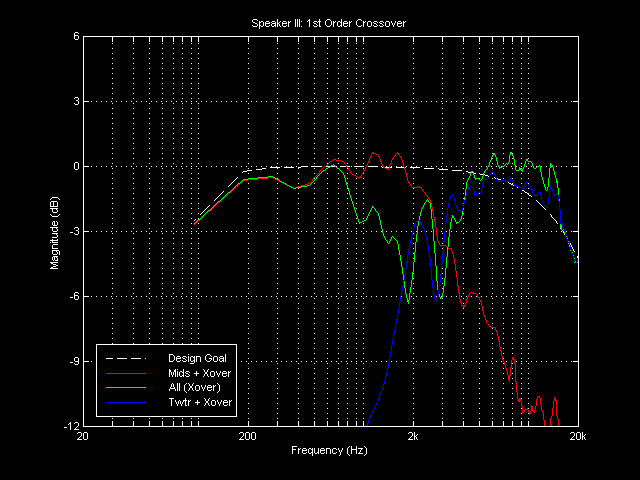
The plot above represents the result of hours upon hours of time spent trying to obtain a first order acoustic response for Speaker III. The dip in response is not deep, only 3-6 dB, but it is quite wide, over an octave. Moreover, this octave is in the 1 kHz to 2 kHz region, the ear’s most sensitive.
I used actual on-axis measurements from prototype cabinet #3 to make the graph. The results would look much worse with off-axis data! Which is another problem with a first order crossover filter. The special crossover behavior for which so many compromises are made disappears quickly off the design’s listening axis.
That is not all. The overall response above the crossover point is not entirely that of the tweeter. About 1 dB of the level is from the mid-range’s response in this region, even though the mid-range is -10 dB down or more. A response region full of chaotic, irregular resonances. Clearly, a supremely non-resonant drivers are desired for a first order crossover design.
Never-the-less, the use of first order filters has its many proponents: Thiel, Dynaudio, and Audio Concepts, just to name a few. (It is worth noting that not all of these designers are going after a first order acoustic response. A 2nd/1st order hybrid crossover with flat frequency response does exist.) The primary arguement for the first order filter’s superiority
is greater time domain fidelity.
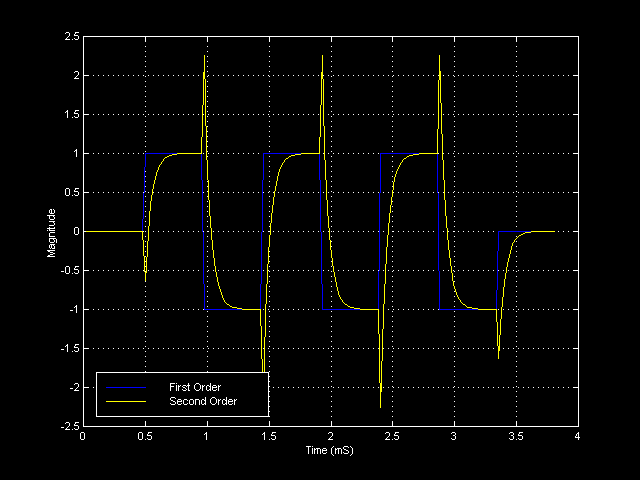
The plot above illustates this point. The yellow line is a digitally simulated total response from a 3 Khz, second order, Linkwitz-Riley filter network to a 1050 Hz square wave. By total response I means the acoustic sum of the tweeter and mid-range units at the listener’s position. The blue line is the 1050 Hz square wave and is also the output of a first order filter network. (For those interested in the exact filter I used, it is y[n] = a*y[n-1] – a*x[n] + x[n-1], where a = 0.6283.)
The big question: can the difference in these response actually be heard? The plot above is quite ominous looking, hinting that the answer must be yes. I had to know, so I performed the following experiment:
- Extracted the audio from a few of my favorite compact discs using the
ability of most PC CD-ROM drives to read the digital audio data directly.
(The process is formally referred to as digital audio extracton.) - Wrote a computer program using MATLAB to load the data and simulate the crossover’s acoustic filtering. The filter simulation was for a 3 kHz, second order, Linkwitz-Riley crossover network’s on axis response.
- Filtered the data and wrote out the result in a 0.1 Hz multiplexed manner. That is, the first 10 seconds of the output where the unfiltered data, the next 10 seconds where the simulated filter output, then the next 10 seconds were the unfiltered data, etc.
- Burned the various songs I selected onto a CD-R.
- Played my new CD-R on my Martin Logan CLS IIz system. The CLS IIz are crossoverless…
What did I conclude after several listening sessions? I couldn’t tell when the simulated crossover filter was “switched in” or “switched out”. Not even watching the time counter on my transport.
My conclusion from the experiment is obvious. I don’t see paying all the first order crossover penalties for a “benefit” that I can’t hear. Is my experiment conclusive? No, the simulated crossover frequency was 3 kHz, and I only tested 8 songs. Plus, the reason for the improvements of a first order crossover may have nothing to do with time domain response. The simple is better phylosophy may apply, meaning that fewer filter elements translates into less coloration.
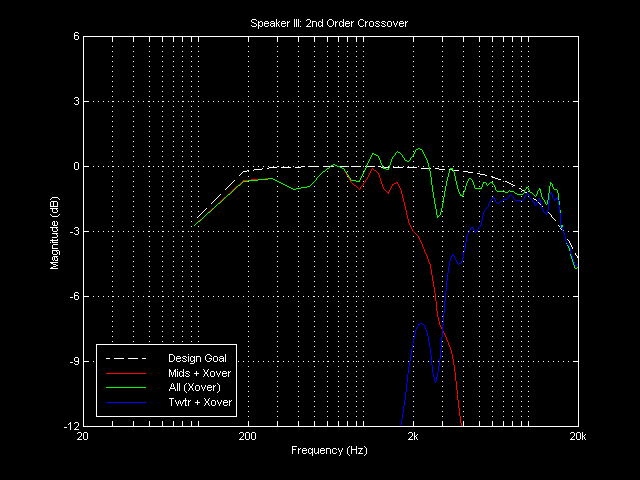
Here is the simulated Speaker III on-axis response to a second order crossover design
that I worked out:
The improvement in frequency response over the first order filter is tremendous. Also note that the high-frequency response is not contaminated nearly as much by the mid-range.
